Day trading involves making quick decisions in a market where prices change rapidly. One of the hardest parts of trading is figuring out what’s real and what’s just noise. Moving averages help by smoothing out these daily price changes, giving you a clearer view of where the market is heading.
Moving averages are more than just a tool—they’re essential to many trading strategies. They help you see the bigger picture, making it easier to decide when to buy, sell, or hold your position. Whether you’re looking at short-term price movements or long-term trends, knowing how to use moving averages can improve your trading.
In this blog, we’ll break down how moving averages work, the different types you can use, and how to choose the right one for your trading style.
You’ll also learn practical ways to apply them, helping you make better decisions in your day trading.
Moving averages are a tool or indicator that traders use to smooth out the ups and downs in price data. Instead of looking at every single price point, a moving average shows you the average price over a certain period of time. This helps you see the overall direction of the market without getting distracted by daily price swings.
Imagine you’re tracking the daily temperature over a month. Some days might be much hotter or colder than others, but if you average the temperatures over a week, you’ll see a clearer pattern of warming or cooling. Moving averages do the same thing for prices in the market, helping you spot trends more easily.
There are two common types of moving averages: Simple Moving Averages (SMA) and Exponential Moving Averages (EMA). Both serve the same basic purpose but do it in slightly different ways.
One of the main reasons traders use moving averages is to identify trends in the market. When the price is consistently above the moving average, it usually means the market is in an uptrend. When the price is below the moving average, it typically indicates a downtrend.
Moving averages make it easier to see these trends by filtering out the noise of daily price movements. This helps you make better decisions about when to enter or exit a trade.
For example, if you see that the price has crossed above the moving average, it could be a sign that the market is starting to move upward, and it might be a good time to buy.
Let’s consider a real-world example: Imagine you’re trading a popular stock, and you’ve set up a 50-day simple moving average on your chart. For several weeks, the stock price has been below the 50-day moving average, indicating a downward trend. However, over the last few days, the price starts creeping upward and eventually crosses above the 50-day moving average. This crossover can signal that the downward trend is potentially reversing, and a new upward trend might be beginning. This could be your cue to consider entering a long position, anticipating that the price will continue to rise.
This kind of trend-spotting is a fundamental use of moving averages, helping you stay on the right side of the market and make more informed trading decisions.
Moving averages are widely used in day trading because they offer several clear benefits, but they also come with some challenges. Here’s a look at both the advantages and the potential drawbacks, along with some examples to make things clearer.
For example, if a stock is bouncing between a certain high and low price, the moving average might stay flat, offering little help. In such cases, combining moving averages with other tools like support and resistance levels can give you a better idea of when to trade.
Choosing the right moving average length is crucial because it directly affects how you interpret market trends and make trading decisions.
The length of the moving average determines how sensitive it is to price changes, which in turn impacts how quickly or slowly it responds to market movements.
Understanding the difference between short-term and long-term moving averages, and how they behave across different time frames, can help you select the best one for your trading style.
Short-Term Moving Averages: A short-term moving average covers a brief period, typically anywhere from 5 to 20 days. It’s highly sensitive to recent price changes, which makes it a good tool for catching quick market movements. However, this sensitivity can also make it more prone to false signals, especially in choppy or sideways markets.
Example: Let’s say you’re using a 10-day moving average to trade a fast-moving tech stock. The stock price has been volatile, with sharp daily fluctuations. The 10-day moving average will closely follow these price movements, quickly indicating potential buy or sell opportunities.
For instance, if the stock price suddenly spikes, the 10-day moving average will rise rapidly, signaling a possible uptrend. However, if the market is unstable, this same sensitivity might lead you to enter or exit trades prematurely, based on short-lived price movements.
Long-Term Moving Averages: On the other hand, long-term moving averages cover a more extended period, usually ranging from 50 to 200 days. They are less sensitive to short-term price changes and provide a broader view of the market’s overall trend. Because they smooth out the daily price fluctuations, long-term moving averages are better at filtering out noise, helping you focus on the bigger picture.
Read : How to use 200 EMA in swing trading?
Example: Imagine you’re trading a blue-chip stock with a 200-day moving average. The stock price might experience daily ups and downs, but the 200-day moving average will change more gradually, offering a more stable trendline. If the price stays consistently above the 200-day moving average, it indicates a long-term uptrend, and you might consider holding onto your position for a longer period. This stability makes long-term moving averages particularly useful for traders who prefer a more conservative approach.
The effectiveness of a moving average can vary depending on the time frame you’re trading in. Different traders, from day traders to long-term investors, may use different moving average lengths to suit their strategies.
Short Time Frames: When trading on short time frames, such as 1-minute or 5-minute charts, short-term moving averages (like the 5-day or 10-day MA) are more commonly used. These moving averages react quickly to price changes, helping you capitalize on small price movements.
Example: Suppose you’re a day trader using a 5-minute chart. You might apply a 9-period moving average to help identify quick buying or selling opportunities. If the price crosses above this short-term moving average, it might signal a potential entry point for a quick trade. However, this approach requires constant attention and quick decision-making, as the short time frame increases the risk of false signals.
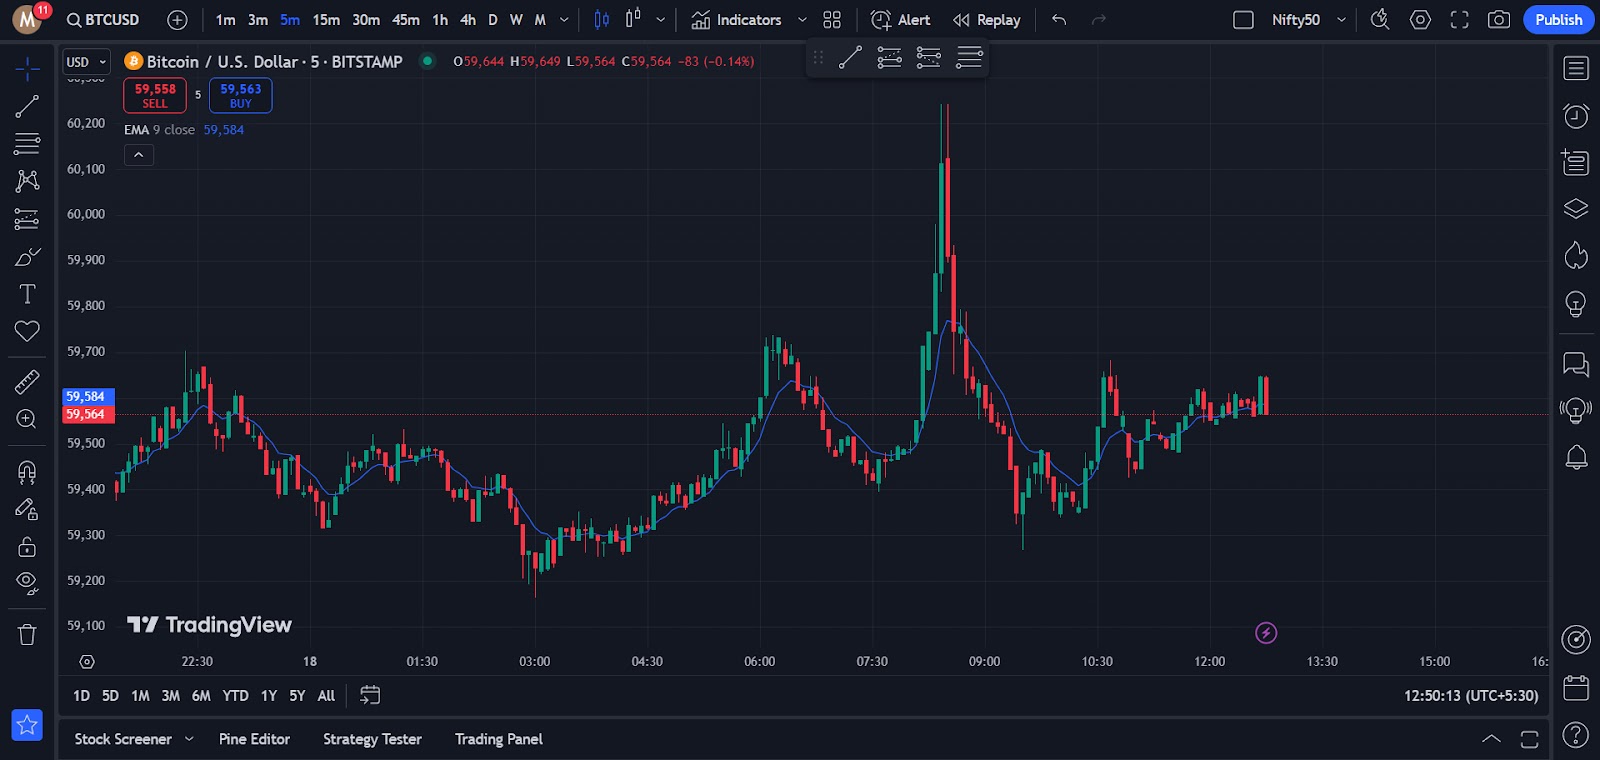
As you can see in the image below, the 9-period EMA on a 5-minute BTC/USD chart helps identify short-term trends. When the price is above the 9 EMA, it generally indicates an uptrend, while prices below the 9 EMA suggest a downtrend. You can use this method to quickly spot potential trade opportunities. However, it’s important to combine this with other confirmations and a well-planned trading strategy to improve the accuracy of your trades and avoid false signals.
Longer Time Frames: For longer time frames, such as daily or weekly charts, longer moving averages like the 50-day or 200-day MA are more appropriate. These moving averages respond more slowly to price changes, making them better suited for identifying long-term trends.
Example: As a swing trader using a daily chart, you might rely on the 50-day moving average to track the trend over a few weeks or months. If the price crosses above the 50-day moving average and stays there, it could indicate a sustained uptrend, and you might decide to hold your position for a longer period. The slower response of the 50-day MA helps you avoid getting caught up in short-term price swings.
The right moving average length depends on your trading goals, the time frame you’re working with, and your risk tolerance. Here are some guidelines to help you choose:
Example: Let’s say you’re a swing trader who typically holds positions for a couple of weeks. A 20-day moving average might be a good fit because it balances the need for timely signals with the ability to filter out minor price fluctuations. On the other hand, if you were a long-term investor, you might opt for the 200-day moving average, which would give you a clearer view of the broader market trend and help you avoid reacting to short-term noise.

As you can see in the chart below, on the 1-hour timeframe, the stock is in an uptrend when it closes and sustains above the 20 EMA. This indicates that the momentum is still strong in the upward direction. On the other hand, when the price dips and closes below the 20 EMA, it can signal a potential shift in the trend.
You can use this setup for swing trading, combining the 20 EMA with other indicators for confirmation to increase your trading accuracy and avoid false signals.
Example: If you’re trading in a highly volatile cryptocurrency market, you might use a 9-day moving average to catch short-term trends. However, you could also add a 50-day moving average to your chart to help confirm the trend direction, reducing the chance of getting caught by false signals.
Example: You might start with a 20-day moving average and notice that it gives you too many signals, leading to overtrading. By testing a 50-day moving average, you might find that it reduces the number of signals but increases their accuracy, making it a better fit for your strategy.
The crossover strategy is a straightforward yet powerful way to identify potential buying and selling opportunities in the market. By watching how two moving averages interact, you can get clear signals on when to enter or exit a trade. Let’s dive into how this strategy works, how you can use it, and explore a general example.
The crossover strategy involves using two different moving averages: a short-term moving average and a long-term moving average. The idea is simple: when the short-term moving average crosses above the long-term moving average, it’s often a signal to buy. Conversely, when the short-term moving average crosses below the long-term moving average, it’s usually a signal to sell.
Why It Works: The logic behind this strategy is based on the idea that the short-term moving average reacts more quickly to recent price changes, while the long-term moving average reflects the broader market trend. When the short-term average moves above the long-term average, it suggests that recent prices are rising faster than the broader trend, indicating potential upward momentum. The opposite is true when the short-term average crosses below the long-term average, signaling potential downward momentum.
To use the crossover strategy effectively, you need to choose the right moving averages for your trading style. Commonly used pairs are the 50-day and 200-day moving averages for longer-term trades, or the 9-day and 21-day moving averages for shorter-term trades.
Steps to Use the Crossover Strategy:
Imagine you’re watching a stock that has been in a downtrend for several weeks. You decide to use the crossover strategy to help identify when the trend might reverse. You set up your chart with a 10-day moving average and a 50-day moving average.
For several days, the 10-day moving average stays below the 50-day moving average, confirming the downtrend. However, one day, the stock price begins to rise, and eventually, the 10-day moving average crosses above the 50-day moving average. This crossover suggests that the short-term trend is gaining strength, and it might be a good time to consider buying the stock.
Conversely, after an uptrend, if the 10-day moving average crosses back below the 50-day moving average, it could signal that the momentum is weakening, and it might be time to sell or avoid entering a new trade.
Moving averages aren’t just useful for spotting trends—they can also serve as dynamic support and resistance levels on your charts. This means that prices often tend to “bounce” off moving averages, much like they do with traditional support and resistance lines. Understanding how this works can help you make better trading decisions.
Support and resistance levels are key concepts in trading. Support is a price level where an asset tends to stop falling and may start rising again, while resistance is a level where it tends to stop rising and may start falling. When prices approach these levels, they often struggle to break through, leading to reversals or pauses in the trend.
Moving averages can act as these levels because they represent an average of past prices. When a price is above a moving average, the average often acts as a support level—meaning the price might dip down to the moving average but then bounce back up. Conversely, when a price is below a moving average, the average can act as resistance, preventing the price from rising further.
To spot these key levels on your charts, you’ll need to add a moving average and watch how the price interacts with it. Here’s how you can do it:
Example 1: Moving Average as Support Imagine you’re trading a stock that has been steadily rising over the past few months. You have a 50-day moving average on your chart, and you notice that each time the price dips down to this moving average, it bounces back up. This repeated behavior suggests that the 50-day moving average is acting as a strong support level. If the price approaches the moving average again, you might consider it a good opportunity to buy, expecting the price to bounce up once more.
Example 2: Moving Average as Resistance Now, imagine you’re observing a stock that has been in a downtrend. The price is below the 50-day moving average, and each time it tries to rise, it hits the moving average and then falls back down. In this case, the 50-day moving average is acting as a resistance level. If the price approaches the moving average again, you might decide to sell or avoid buying, anticipating that the price will struggle to break above this level.
Moving averages are powerful tools in a trader’s toolkit, but like any tool, they need to be used correctly. Misunderstanding or misapplying them can lead to poor trading decisions and losses. In this section, we’ll discuss some common mistakes traders make with moving averages and provide insights on how to avoid them.
One of the biggest mistakes traders make is relying solely on moving averages to make their trading decisions. While moving averages are great for identifying trends, they don’t tell you everything about the market. They’re based on past price data, which means they lag behind current market conditions. This lag can cause you to enter or exit trades too late, missing the best opportunities.
Think of moving averages as part of a broader toolkit. They’re excellent for confirming trends, but you should always consider other factors before making a trade. For example, combining moving averages with momentum indicators like the Relative Strength Index (RSI) can give you a more comprehensive view of the market. This combination helps you avoid the pitfall of entering a trade just because the moving averages suggest a trend, without considering whether that trend is losing strength.
Another common mistake is misinterpreting the signals that moving averages give you. A crossover, for instance, is often seen as a strong buy or sell signal, but it’s not foolproof. In choppy or sideways markets, crossovers can lead to false signals, causing you to enter trades that quickly turn against you.
Before acting on a moving average signal, always look at the broader market context. If the market is in a clear trend, moving average signals are more reliable. However, in a ranging market where the price moves sideways, crossovers can occur frequently without indicating a true change in trend.
One way to avoid false signals is to wait for confirmation from other indicators or price action.
For example, if you see a bullish crossover, you might wait for the price to break above a recent high before entering a trade. This extra step can save you from jumping into trades prematurely.
Whipsaws are one of the most frustrating challenges when using moving averages. A whipsaw occurs when the price repeatedly crosses above and below a moving average, triggering multiple false signals. This is common in volatile markets, where the price action is erratic and unpredictable.
To protect yourself from whipsaws, consider using a combination of moving averages with different lengths. For example, instead of relying solely on a single 50-day moving average, you could use a 50-day and a 200-day moving average together. If both moving averages give you a similar signal, it’s more likely to be valid. Another strategy is to use a filter, such as requiring the price to stay above or below the moving average for a certain number of periods before acting on the signal. This helps you avoid reacting to short-term noise.
Additionally, consider reducing your position size in highly volatile markets to minimize the impact of whipsaws on your trading account. In these conditions, it might also be wise to trade less frequently and focus on quality setups where the trend is clearer and the signals are more reliable.
One of the most powerful ways to avoid the common pitfalls of moving averages is to combine them with price action analysis. Moving averages can give you a general sense of the trend, but price action tells you how the market is behaving in real time.
For example, if a moving average is acting as support, look at how the price behaves when it touches the moving average. Are there long wicks indicating strong buying pressure? Is the price forming higher lows near the moving average? These details can give you a much clearer picture of what’s happening and help you make more informed decisions.
Always remember that moving averages are guides, not guarantees. By combining them with other indicators for multiple confirmations and keeping a close eye on market behavior, you can significantly improve your trading performance and avoid common mistakes that trap less experienced traders.
In this blog, we’ve explored how moving averages can be powerful tools in your day trading strategy. You learned about the different types of moving averages and how to choose the right one for your trading style.
We discussed how to use moving averages to identify trends, spot key support and resistance levels, and avoid common mistakes like relying too heavily on moving averages or misinterpreting signals. By understanding these concepts, you’re better equipped to make smarter, more informed trading decisions.
If you’re ready to take your trading skills to the next level, consider enrolling in the ETTFOS Trading Masterclass. In this course, we dive deeper into advanced trading strategies with our 30 years of experience in trading.
The best moving average for day trading largely depends on your specific strategy and market conditions. However, many day traders prefer using shorter-term moving averages like the 9-day or 21-day Exponential Moving Average (EMA). These shorter EMAs react more quickly to price changes, providing timely signals that are crucial for the fast-paced nature of day trading.
Day traders typically favor the Exponential Moving Average (EMA) over the Simple Moving Average (SMA). This preference is due to the EMA’s ability to give more weight to recent price data, making it more responsive to price movements. The quicker response of the EMA allows traders to react faster to potential trading opportunities, which is essential in intraday trading.
The 9-day EMA is commonly used for intraday trading because it offers a good balance between sensitivity and reliability. It reacts quickly enough to capture short-term price movements while filtering out some of the noise. Traders also use the 21-day EMA as a longer-term reference within intraday trading to identify the overall trend.
Yes, moving averages can be effective for spotting potential reversals. A common method is to look for a crossover, where a shorter-term moving average crosses above or below a longer-term moving average. For example, if a 9-day EMA crosses above a 21-day EMA, it might indicate a bullish reversal. Conversely, a crossover below might signal a bearish reversal. However, it’s important to confirm these signals with other indicators or price action to reduce the risk of false signals.
Yes, using multiple moving averages can provide more reliable trading signals. By combining a short-term moving average with a longer-term one, you can better identify the direction of the trend and filter out false signals. For instance, a common strategy is to use the 50-day and 200-day moving averages together; when the shorter MA crosses the longer one, it can indicate a significant change in trend. This approach helps traders make more informed decisions by providing a clearer picture of market conditions.

ETTFOS brings over 35 years of trading experience to deliver well-researched, educational content designed to enhance your understanding of the financial markets. Our blog covers key market insights and trading concepts to help you stay informed and sharpen your skills. Follow us for expert updates and in-depth articles.