Scalping is a quick trading strategy that involves making fast decisions and precise trades. To do this successfully, traders use various tools called technical indicators. These indicators help traders see market trends, momentum, and potential price changes.
In this blog, we will look at some of the best indicators for scalping, like Moving Averages (MA), Relative Strength Index (RSI), Moving Average Convergence Divergence (MACD), Bollinger Bands, Volume Indicators, and the Stochastic Oscillator. We’ll explain what each indicator is, how to use them in your trading, and give practical examples. Whether you are new to scalping or want to improve your strategies, this guide will help you use these indicators to enhance your trading.
Moving averages (MA) are tools that help traders see the average price of an asset over a certain period. They smooth out the price data to show the direction of the trend. There are two main types of moving averages: Simple Moving Averages (SMA) and Exponential Moving Averages (EMA).
Simple Moving Averages (SMA)
A Simple Moving Average (SMA) calculates the average price over a set number of periods. For example, a 10-day SMA adds up the closing prices of the last 10 days and divides by 10. This creates a line on the chart that shows the overall trend. In scalping, SMAs help identify short-term trends.
Exponential Moving Averages (EMA)
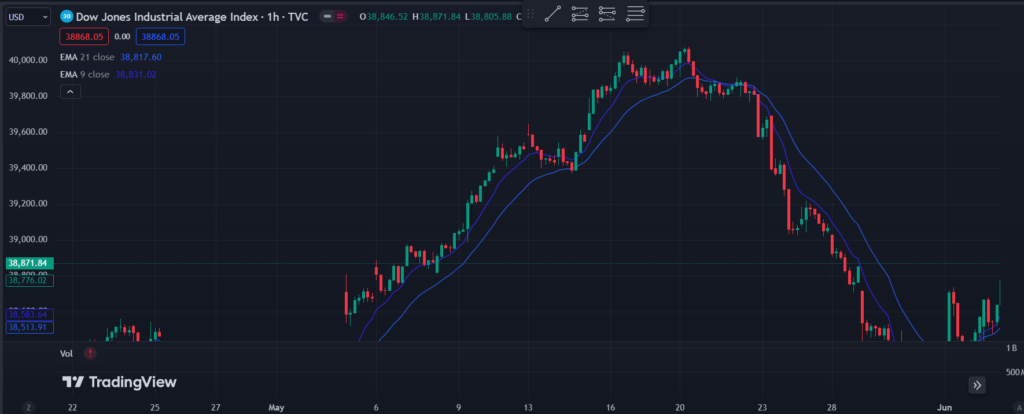
An Exponential Moving Average (EMA) also calculates the average price, but it gives more importance to recent prices. This makes the EMA react faster to price changes. In scalping, EMAs are often preferred because they quickly show changes in price direction.
How to Use SMAs and EMAs in Scalping
Traders use SMAs and EMAs to find trends and decide when to buy or sell. For example, a common strategy is to use two EMAs: one short-term (like a 9-period EMA) and one long-term (like a 21-period EMA). When the short-term EMA crosses above the long-term EMA, it’s a signal to buy. When it crosses below, it’s a signal to sell.
Imagine you are scalping a stock and you set up a 9-period EMA and a 21-period EMA on your chart. You notice that the 9-period EMA crosses above the 21-period EMA, signaling an upward trend. You decide to buy 100 shares at $50 each. After a short period, the price rises to $50.50. When you see the 9-period EMA starting to turn down, you sell your shares at $50.50, making a quick profit of $50.
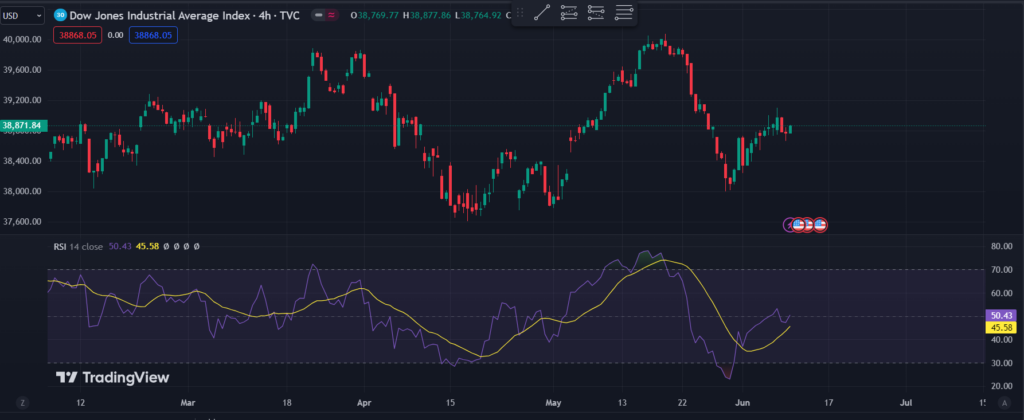
The Relative Strength Index (RSI) is a tool that measures how fast and how much the price of an asset is changing. It helps traders see if an asset is overbought (price is too high) or oversold (price is too low). The RSI ranges from 0 to 100. Values above 70 suggest the asset is overbought, and values below 30 suggest it is oversold.
Why is RSI Useful in Scalping?
RSI is useful in scalping because it helps you find short-term price extremes. By identifying these extremes, you can make quick decisions to buy or sell. For example, if the RSI shows an asset is overbought, you might sell expecting the price to drop. If the RSI shows the asset is oversold, you might buy expecting the price to rise.
How to Interpret RSI Signals
To use the RSI in scalping, look for the following signals:
For instance, Imagine you are scalping a stock and the RSI shows a value of 75, indicating the stock is overbought. You decide to sell 100 shares at $100 each. Shortly after, the price drops to $99, and you buy back the 100 shares. This gives you a quick profit of $100.
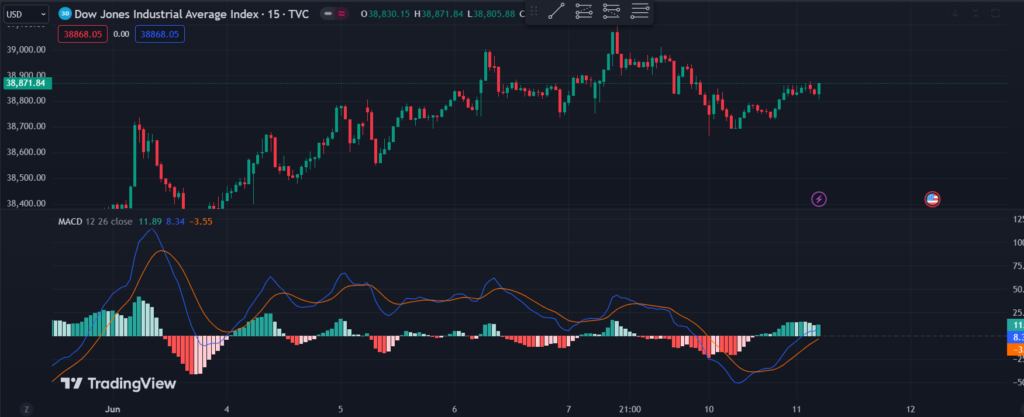
The Moving Average Convergence Divergence (MACD) is a tool that shows the relationship between two moving averages of an asset’s price. It helps traders see changes in the strength, direction, and momentum of a trend.
The MACD is made up of three parts:
MACD Line: The difference between the 12-period EMA and the 26-period EMA.
Signal Line: A 9-period EMA of the MACD Line.
Histogram: The difference between the MACD Line and the Signal Line.
When the MACD Line crosses above the Signal Line, it’s a signal to buy. When it crosses below, it’s a signal to sell. The Histogram shows the difference between these two lines and helps identify the strength of the buy or sell signals.
How to Use MACD for Identifying Trends and Reversals in Scalping
The MACD helps scalpers spot trends and potential reversals. Here’s how to use it:
Imagine you are scalping a stock and you see the MACD Line crossing above the Signal Line, indicating an upward trend. You decide to buy 100 shares at $20 each. As the trend continues, the price rises to $20.50. You notice the MACD Line starting to turn down towards the Signal Line, signaling a possible end to the trend. You sell your shares at $20.50, making a quick profit of $50.
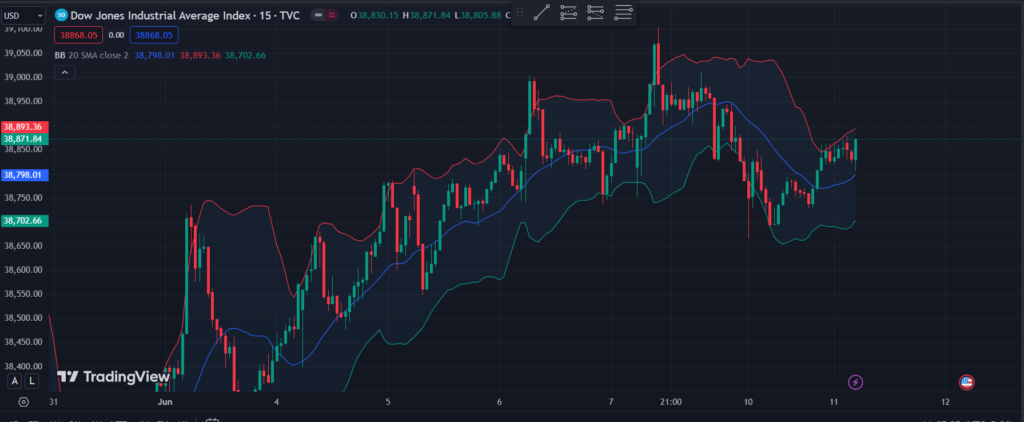
Bollinger Bands are a tool that helps traders understand the volatility of an asset’s price. They consist of three lines: the middle band, which is a simple moving average (SMA), and the upper and lower bands, which are standard deviations away from the SMA.
The middle band is typically a 20-day SMA. The upper and lower bands are usually set two standard deviations away from the middle band. When the price moves closer to the upper band, it indicates that the asset might be overbought. When the price moves closer to the lower band, it indicates that the asset might be oversold.
How to Use Bollinger Bands to Identify Overbought and Oversold Conditions
Traders use Bollinger Bands to identify overbought and oversold conditions, which can help them decide when to buy or sell.
For example, you are scalping a stock and you see that the price has touched the upper Bollinger Band, indicating that the stock might be overbought. You decide to sell 100 shares at $100 each. Shortly after, the price drops to $99 and you buy back the 100 shares, making a quick profit of $100.
Volume indicators are important tools for scalping because they show how much an asset is being traded. High volume means lots of people are buying and selling, which makes it easier to trade quickly and confirms the strength of price movements.
Importance of Volume in Scalping
Volume is crucial in scalping because it shows the level of interest in an asset. High trading volume means there are many buyers and sellers, which makes it easier to enter and exit trades quickly. Low volume can lead to unexpected price changes, which can be risky for scalpers.
How to Use Volume Indicators to Confirm Trades
Volume indicators help confirm whether price movements are strong and likely to continue. Here’s how to use them:
Imagine you are scalping a stock, and you see the price going up. To make sure this trend is strong, you look at the volume indicator and see a big increase in volume. This confirms that many people are buying, so you decide to buy 200 shares at $50 each. As the price continues to rise, you sell your shares at $50.50, making a quick profit of $100. On the other hand, if the price was rising but the volume was decreasing, you might avoid entering the trade, reducing the risk of losses from a weak trend.
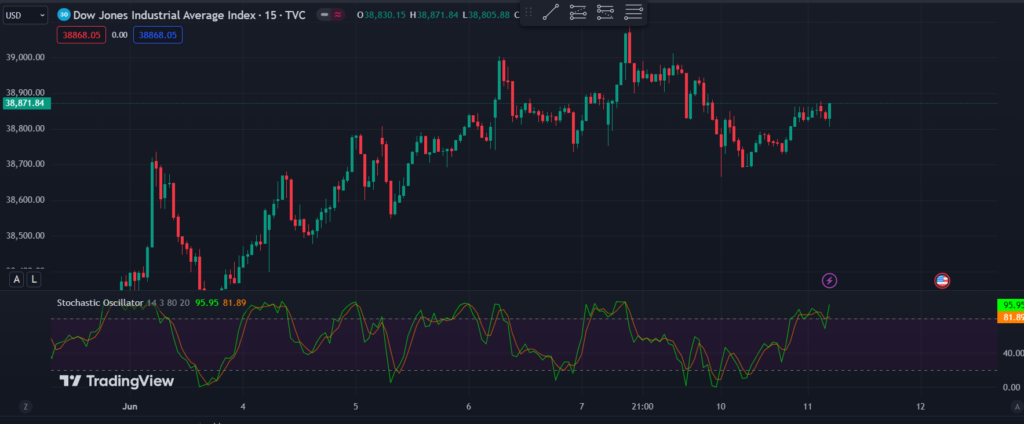
The Stochastic Oscillator is a tool that helps traders see if an asset is overbought or oversold. It compares the closing price of an asset to its price range over a certain period. The oscillator moves between 0 and 100. Values above 80 indicate that the asset might be overbought, while values below 20 suggest that the asset might be oversold.
How to Use the Stochastic Oscillator to Identify Potential Buy and Sell Signals
The Stochastic Oscillator is useful for finding buy and sell signals. Here’s how to use it:
Example – Imagine you are scalping a stock and you see the Stochastic Oscillator drop below 20, indicating that the stock might be oversold. When the oscillator rises back above 20, you decide to buy 100 shares at $30 each. After a short time, the price rises to $31. Seeing the oscillator now approaching 80, you decide to sell your shares at $31, making a quick profit of $100. Conversely, if the oscillator had risen above 80 and then started to fall, it would signal a good time to sell, preventing potential losses.
In this guide, we’ve looked at some of the best indicators for scalping. We talked about Moving Averages (MA), which help you see trends using Simple Moving Averages (SMA) and Exponential Moving Averages (EMA). The Relative Strength Index (RSI) helps you spot when an asset is overbought or oversold. The Moving Average Convergence Divergence (MACD) shows changes in trends. Bollinger Bands help you see price volatility and possible reversals. Volume Indicators show the strength of price movements. Lastly, the Stochastic Oscillator helps you find buy and sell signals based on price momentum.
Using these indicators can help you make better trading decisions. Each one gives you different information, and using them together can give you a clearer picture of the market. Remember to practice and keep learning, as this will help you get better at scalping over time.
Indicators are important in scalping because they help traders make quick and informed decisions. They provide insights into market trends, momentum, and potential price reversals, which are crucial for making profitable trades in a short time frame.
It’s not recommended to rely on just one indicator for scalping. Using multiple indicators or multiple confirmations together can give you a more complete picture of the market. This helps confirm signals and reduces the risk of making trades based on false signals.
You should adjust your indicator settings based on your trading strategy and the specific market conditions. Regularly review your settings to ensure they are still effective. If you notice that your current settings are not providing accurate signals, it might be time to adjust them.
The best time frame for using indicators in scalping is typically between 1 to 15 minutes. Shorter time frames, like 1 or 5 minutes, are commonly used because they provide more opportunities for quick trades. However, the best time frame can vary depending on your trading style and the market you are trading in.
To combine indicators for better results, use a mix of trend-following and momentum indicators. For example, you can use Moving Averages (MA) to identify the trend and Relative Strength Index (RSI) or Stochastic Oscillator to find entry and exit points. Confirm signals from one indicator with another to increase the accuracy of your trades.

ETTFOS brings over 35 years of trading experience to deliver well-researched, educational content designed to enhance your understanding of the financial markets. Our blog covers key market insights and trading concepts to help you stay informed and sharpen your skills. Follow us for expert updates and in-depth articles.