Intraday trading, or day trading, is all about making money from short-term price changes in the market. Unlike long-term investing, where you hold onto stocks for months or years, intraday traders aim to make profits within a single trading day. They make sure to close all their trades before the market closes to avoid any overnight surprises.
This type of trading is fast-paced and exciting but requires quick decisions, a good understanding of market trends, and careful risk management. It can be rewarding, but it also needs discipline and attention to detail.
In this guide, we’ll explain the basics of intraday trading, how it works, and the main differences between intraday and long-term trading. We’ll also talk about the tools you need, strategies to use, advanced techniques, practical tips, common mistakes to avoid, and how to get started. Whether you’re new to trading or want to improve your skills, this guide will help you understand intraday trading better.
Intraday trading, also known as day trading, involves buying and selling financial instruments like stocks, commodities, or currencies within the same trading day. The main goal is to take advantage of small price movements that happen during the day. Intraday traders close all their trades before the market closes to avoid the risks that come with holding positions overnight.
For example, you might buy 100 shares of a company at $50 each in the morning. By midday, the stock price rises to $52. You sell your shares, making a profit of $2 per share, or $200 in total, all within a few hours.
Intraday trading requires a solid understanding of market trends and technical analysis. Traders use charts and indicators like moving averages and RSI to predict price movements. Liquidity and volatility are key factors, as they allow traders to enter and exit positions quickly and capitalize on price swings. Risk management is crucial, with tools like stop-loss orders helping to limit potential losses. Discipline and emotional control are also essential to avoid impulsive decisions and stay focused on trading strategies.
Intraday trading involves several key components that traders need to understand to be successful. These components include understanding market hours, the role of brokers, the use of technical analysis, and knowing the different types of orders that can be placed. Let’s explore each of these elements in detail to understand their significance and how they work together in intraday trading.
The first critical component of intraday trading is knowing the market hours. The trading day starts when the market opens in the morning and ends when it closes in the afternoon. For example, in the U.S., the New York Stock Exchange (NYSE) opens at 9:30 AM and closes at 4:00 PM Eastern Time. All trading activities must be completed within this window. The beginning and end of the trading day are often the most active times, with the highest trading volumes and the most significant price movements. Understanding market hours helps traders plan their activities and strategies effectively.
Once you understand market hours, the next step is choosing a reliable broker. Brokers provide the platforms and tools necessary to execute trades. When you open an account with a broker, you gain access to their trading platform, which allows you to buy and sell stocks. Brokers also offer real-time market data, charting tools, and news updates essential for making informed trading decisions. Choosing the right broker is crucial, as they can impact your trading efficiency. Look for brokers that offer low commissions, fast execution speeds, and dependable customer support. Some popular brokers for intraday trading include TD Ameritrade, E*TRADE, and Interactive Brokers.
With a broker and an understanding of market hours in place, the next component is technical analysis. This involves analysing past market data, such as price and volume, to forecast future price movements. Traders use various charts and indicators to identify trading opportunities. For example, candlestick charts provide detailed information about price movements within specific time frames. Indicators like moving averages (MA) help identify trends, while the Relative Strength Index (RSI) measures the speed and change of price movements, indicating whether a stock is overbought or oversold.
The Moving Average Convergence Divergence (MACD) shows the relationship between two moving averages, helping traders identify buy and sell signals. Technical analysis is essential for making informed trading decisions and timing trades effectively.
To execute trades effectively, intraday traders need to understand different types of orders. The main order types are:
Knowing how to use these order types can help you manage your trades better and control your risk. By understanding market hours, choosing a good broker, using technical analysis, and knowing different order types, you can develop a strong strategy for successful intraday trading.
Intraday trading comes with its own set of benefits and risks. Knowing these can help you make smarter decisions and better manage your trading activities.
Let’s explore some of the benefits of intraday trading.
One of the main benefits of intraday trading is that you avoid the risks associated with holding stocks overnight. For instance, if you buy shares in the morning and sell them by the end of the day, you don’t have to worry about unexpected news or events that might affect the stock’s price after the market closes. This means you can sleep soundly, knowing that your positions are closed and there’s no overnight risk hanging over you.
Intraday trading often involves highly liquid stocks. Liquidity means how easily you can buy or sell an asset without causing a big change in its price. For example, trading popular stocks like Apple or Amazon is usually very liquid, so you can quickly enter or exit positions. This high liquidity is crucial because it allows you to capitalize on small price movements and get in and out of trades with ease.
Intraday trading offers the potential for quick profits. Imagine you spot a stock that’s rising in the morning due to some good news. You buy it at $100 and, within a couple of hours, it goes up to $105. You sell it and make a $5 profit per share. By doing this multiple times a day with different stocks, you can accumulate profits quickly. However, this requires a keen eye on the market and the ability to make swift decisions.
Let’s now look at some of the risks involved in intraday trading.
Market volatility is a double-edged sword. While it can create opportunities for profit, it also brings risk. Prices can swing dramatically within a short period, and if the market moves against you, it can lead to significant losses. For example, a stock might suddenly drop due to unexpected news, and if you’re not quick to react, you could end up with a loss.
Intraday trading can be stressful. Constantly watching the markets and making rapid decisions can be mentally exhausting. The pressure to make profits can lead to emotional decisions, which are often not the best ones. For instance, fear and greed can drive you to hold onto losing trades too long or sell winning trades too quickly. It’s important to stay disciplined and stick to your trading plan.
The excitement of intraday trading can sometimes lead to overtrading. This means making too many trades in an attempt to maximize profits, which can actually result in higher transaction costs and poor decision-making. For example, you might end up chasing small price movements without a clear strategy, leading to losses instead of gains. It’s crucial to have a well-defined trading plan and stick to it.
Intraday trading often requires a significant amount of capital. This is because you are aiming to profit from small price movements, so you need to trade in larger volumes to see meaningful returns. Additionally, many brokers have minimum account balance requirements for day traders. Using leverage can increase your potential profits, but it also amplifies your losses. For example, if you’re trading with borrowed funds, a small adverse price movement can wipe out your capital quickly.
By recognizing both the benefits and risks of intraday trading, you can better prepare yourself and create strategies to improve your trading experience. This understanding will help you make smarter decisions and thrive in the fast-paced world of intraday trading.
To be successful in intraday trading, it’s essential to use the right indicators and tools. These tools help you analyze the market, make informed decisions, and execute trades efficiently. Let’s explore some of the key indicators and tools used in intraday trading.
Volume and price action indicators are fundamental tools in intraday trading.
Volume indicators show the number of shares or contracts traded in a security. High volume often indicates strong interest in a stock, which can lead to significant price movements. For example, a sudden increase in volume might suggest that a stock is about to break out from a price range. Volume is a critical factor in confirming price trends and potential reversals. Tools like the On-Balance Volume (OBV) and the Volume Weighted Average Price (VWAP) are commonly used to analyze trading volume.
Price action indicators focus on the movement of a security’s price. Candlestick patterns are a popular type of price action indicator. They provide visual cues about market sentiment and potential reversals. For instance, a “hammer” candlestick pattern might indicate a potential bottom, while a “shooting star” suggests a possible top. Analysing price action helps traders understand market behaviour and make timely trading decisions.
Technical analysis tools are crucial for identifying trends and making predictions about future price movements.
Moving averages (MA) smooth out price data to help identify the direction of a trend. The two most common types are the Simple Moving Average (SMA) and the Exponential Moving Average (EMA). The SMA calculates the average price over a specific period, while the EMA gives more weight to recent prices. Traders use moving averages to identify potential buy and sell signals. For instance, when a short-term moving average crosses above a long-term moving average, it might indicate a buying opportunity.
The RSI is a momentum oscillator that measures the speed and change of price movements. It ranges from 0 to 100, with levels above 70 indicating that a stock might be overbought and levels below 30 suggesting it might be oversold. RSI helps traders identify potential reversal points and assess whether a stock’s price is moving too quickly.
The MACD is a trend-following momentum indicator that shows the relationship between two moving averages of a security’s price. The MACD line is calculated by subtracting the 26-period EMA from the 12-period EMA. When the MACD line crosses above the signal line (a 9-period EMA of the MACD), it may signal a bullish trend. Conversely, when it crosses below, it may indicate a bearish trend.
Access to real-time data and advanced charting software is essential for intraday traders. Real-time data provides up-to-the-minute information on stock prices, volume, and market trends, enabling traders to make timely decisions. Charting software allows traders to visualize market data and apply various technical indicators to analyze price movements. Popular charting software includes TradingView, which offers a wide range of charts and technical indicators, and MetaTrader, which provides advanced charting tools and automated trading capabilities. These platforms help traders identify patterns, track price trends, and execute trades efficiently.
Automated trading systems, also known as algorithmic trading, use computer programs to execute trades based on predefined criteria. These systems can help eliminate emotional decision-making and ensure that trades are executed consistently according to the trading strategy. Automated trading systems can be programmed to follow specific technical indicators, such as moving averages or RSI, and execute trades when certain conditions are met. This allows traders to take advantage of market opportunities without constantly monitoring the market. Additionally, automated systems can execute trades faster than manual trading, which is crucial in the fast-paced world of intraday trading.
Using these key indicators and tools, you can analyze the market more effectively and make informed decisions. Whether you rely on volume and price action indicators, technical analysis tools, real-time data, or automated trading systems, having the right tools at your disposal is essential for success in intraday trading.
Intraday trading requires a well-thought-out strategy to navigate the fast-paced market. Here are some key strategies that intraday traders often use to maximize their profits and minimize their risks.
Trend following is a popular intraday trading strategy that involves identifying the direction of the market trend and making trades that align with that trend. The idea is to buy stocks that are trending upwards and sell them when they start to show signs of reversing. Similarly, for a downward trend, you would sell or short-sell stocks and buy them back when the trend shows signs of reversal.
Traders use various tools like moving averages, trend lines, and technical indicators to identify trends. For instance, if a stock consistently stays above its 50-day moving average, it is considered to be in an uptrend. By following the trend, traders aim to capture the majority of the trend’s movement and avoid trading against the market’s direction.
Scalping is an intraday trading strategy focused on making numerous small profits throughout the day. Scalpers aim to take advantage of tiny price gaps created by order flows or spreads. They typically hold positions for just a few seconds to a few minutes.
This strategy requires a significant amount of time and attention, as well as quick decision-making skills. Scalpers often use real-time charts and indicators like the order book, volume, and tick charts to identify entry and exit points. For example, a scalper might buy a stock at $50.05 and sell it at $50.10, making a small profit of 5 cents per share. Repeating this process multiple times can accumulate significant profits over the trading day.
Momentum trading involves identifying stocks that are moving significantly in one direction on high volume and riding the momentum until it shows signs of reversal. The idea is to buy stocks that are moving up strongly or sell stocks that are moving down strongly.
Traders look for stocks that are making substantial moves, often triggered by news events, earnings reports, or other catalysts. Indicators such as the Relative Strength Index (RSI) and Moving Average Convergence Divergence (MACD) can help identify stocks with strong momentum. For example, if a stock breaks out of a consolidation pattern on high volume, a momentum trader might buy the stock and hold it until the momentum slows down or reverses.
Reversal trading, also known as counter-trend trading, involves identifying points where a stock’s price is likely to reverse direction. This strategy is based on the idea that prices tend to overextend in one direction before reversing.
Traders use technical analysis tools such as support and resistance levels, candlestick patterns, and indicators like the RSI and MACD to identify potential reversal points. For instance, if a stock has been in a downtrend but reaches a strong support level, a reversal trader might buy the stock, anticipating a price bounce. Conversely, if a stock is in an uptrend but hits a strong resistance level, the trader might sell or short the stock, expecting a pullback.
Example
Imagine you are watching a stock that has been trending upwards steadily. Using the trend following strategy, you decide to buy when it pulls back to its 20-day moving average, anticipating it will continue its upward trajectory. Throughout the day, you also notice quick price movements and small gaps in another stock. Using scalping, you make several small trades, buying and selling within minutes, to capture these tiny profits. Later, you see a stock breaking out of a range on high volume due to positive news. Employing momentum trading, you buy into the rally and ride the upward momentum. Towards the end of the day, you spot a stock that has been overbought and is now hitting a strong resistance level. Using reversal trading, you short the stock, expecting it to pull back.
To make your intraday trading strategy stronger, it’s important to understand advanced technical analysis techniques. These methods help you see market trends and possible price changes more clearly. Here are some advanced methods that experienced traders often use:
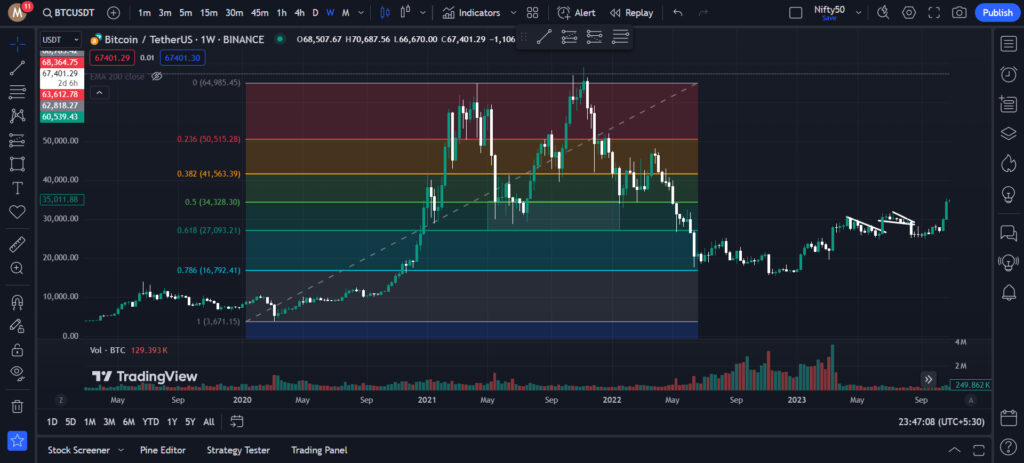
Fibonacci retracement levels help traders find potential support and resistance levels based on the idea that prices often retrace a predictable part of a move before continuing in the original direction. These levels are drawn using horizontal lines on a price chart, typically at 23.6%, 38.2%, 50%, 61.8%, and 100%.
For example, if a stock moves from $100 to $150, you can use Fibonacci retracement levels to predict possible pullback points. The 38.2% level would be around $130.90. If the stock pulls back to this level and then moves up again, it confirms the support and can be a good point to enter a trade.
Also, take a look at the below example of a Bitcoin chart:
Elliott Wave Theory is a method for predicting market direction by identifying patterns in price movements. According to this theory, market trends unfold in a series of five waves in the direction of the main trend, followed by three corrective waves in the opposite direction.
For example, if you identify a stock in the third wave of an uptrend, you might expect it to continue rising. Recognizing these patterns helps you anticipate future price movements. If the stock is in a corrective phase, you can prepare for the continuation of the trend after the correction is complete.
Market depth shows the number of buy and sell orders at different price levels for a security. This information helps traders understand the supply and demand in the market.
Order flow analysis looks at the actual orders being executed. By following the flow of large orders, you can see how major players are influencing the market. For example, if there are many large buy orders at a certain price, it indicates strong support, and you might decide to buy at that level.
Example
Let’s say you’re trading a stock that has been trending upward. Using Fibonacci retracement levels, you see that the stock might pull back to the 38.2% level. You place a buy order near this level, expecting a bounce. You also apply Elliott Wave Theory and notice that the stock is likely in the third wave of an uptrend, suggesting further upward movement. Additionally, you check market depth and see strong buy orders around your Fibonacci level, confirming your decision to buy.
Using these advanced techniques, you can better understand market behavior and make smarter trading decisions. This way, you increase your chances of successful trades and improve your overall trading strategy.
Even after learning about technical analysis and advanced strategies, many traders still make common mistakes that can lead to significant losses. To help you avoid these pitfalls and improve your trading performance, here are some practical tips to succeed in intraday trading:
1. Setting Realistic Goals
One of the first steps to success in intraday trading is setting realistic goals. It’s important to understand that while intraday trading offers the potential for quick profits, it also comes with risks. Start by setting achievable daily, weekly, and monthly profit targets. Avoid aiming for unrealistic returns as this can lead to overtrading and emotional decisions. For example, instead of aiming to double your money in a week, set a goal to make a consistent 1-2% return on your capital daily. This approach helps you stay focused and disciplined.
2. Risk Management Techniques
Effective risk management is essential in intraday trading. Always use stop-loss orders to limit potential losses on a trade. A common rule is not to risk more than 1-2% of your trading capital on a single trade. For example, if you have $10,000 in your trading account, you should not risk more than $100-$200 per trade. This helps protect your capital and ensures that a few bad trades won’t wipe out your account.
Position sizing is another crucial aspect of risk management. Adjust the size of your trades based on your risk tolerance and the volatility of the market. By managing your risk effectively, you can stay in the game longer and increase your chances of success.
3. The Importance of a Trading Journal
Keeping a trading journal is a valuable practice for intraday traders. In your journal, record details of each trade, including the entry and exit points, the size of the position, the reason for the trade, and the outcome. Reviewing your trades regularly can help you identify patterns, learn from your mistakes, and improve your trading strategies.
For example, you might notice that trades made during certain times of the day are more profitable, or that specific setups lead to consistent losses. By analyzing this information, you can adjust your strategies and avoid repeating past mistakes.
4. Continuous Learning
The financial markets are constantly evolving, and so should your trading skills. Continuous learning is key to staying ahead in intraday trading. Stay updated with market news, read trading books, take online courses, and join trading communities to learn from other traders.
For instance, you might read books on technical analysis, attend webinars on advanced trading strategies, or participate in online forums where traders share insights and experiences. By continuously improving your knowledge and skills, you can adapt to changing market conditions and refine your trading strategies.
Example
Imagine you set a realistic goal of making a 1% return on your capital daily. You risk only 1% of your capital on each trade and use stop-loss orders to protect your account. You keep a detailed trading journal and review it regularly, noticing that morning trades are more profitable for you. You focus on learning more about trading during peak market hours and adjust your strategies accordingly.
By following these practical tips, you can develop a disciplined approach to intraday trading, manage your risks effectively, and continually improve your trading performance. This balanced and thoughtful approach increases your chances of long-term success in the fast-paced world of intraday trading.
We’ve already discussed many aspects of intraday trading in this blog. Now, let’s finally talk about how you can get started with intraday trading.
1. Trading Education
Before you start trading, it’s crucial to educate yourself about the basics of intraday trading. Understanding how the market works, the different types of orders, and the key technical indicators is essential. There are many resources available online, including free courses, webinars, and tutorials. You can also read books on trading strategies and technical analysis to deepen your knowledge. The more you learn, the better prepared you’ll be to make informed trading decisions. For example, spending a few weeks going through online courses and reading books can help you understand market dynamics and the strategies used by successful traders.
If you are serious about your trading education, we have something for you. With our 30 years of experience in trading, we offer exclusive trading programs for a select group of members. You can explore more about our program or book a consultation call using the links below. This program is designed to provide in-depth knowledge and personalized guidance to help you succeed in the world of intraday trading.
✅ Each session is 2 to 4 hours long
✅ Participants will receive a full business starter kit including names and contracts
✅ Participants will have access to trading tools illustrating live real-time market data
✅ Each session is 2 to 4 hours long
✅ This program is designed for advanced traders
✅ Participants will receive a full business starter kit including names and contracts & trading tools illustrating live real-time market data
✅ This program is designed for advanced traders
✅ Each session is 2 to 4 hours long
✅ Participants will receive a full business starter kit including names and contracts & trading tools illustrating live real-time market data
2. Choosing the Right Broker
The first step is finding the right broker. You need a broker that offers a reliable trading platform, low fees, and good customer support. Look for one that provides real-time data, easy-to-use charting tools, and fast trade execution. Ensure the broker is reputable and has a user-friendly platform that suits your trading needs. This will make your trading experience smoother and more efficient.
3. Practice with Simulation Software (Demo Account)
Once you have a good understanding of the basics, it’s time to practice your skills with simulation software. Many brokers offer demo accounts that allow you to trade with virtual money. This is a great way to test your strategies and get a feel for the market without risking real money. Use the demo account to practice placing trades, setting stop-loss orders, and managing your positions. Practicing with simulation software helps build your confidence and refine your trading techniques. For instance, using a demo account helps you become familiar with the trading platform and allows you to test different strategies to see what works best.
4. Starting Small
When you feel ready to start trading with real money, it’s important to start small. Begin with a small amount of capital that you can afford to lose. This will help you manage your risk and minimize potential losses while you gain experience. As you become more comfortable and confident in your trading abilities, you can gradually increase the amount of capital you invest. Starting small allows you to learn from your mistakes and improve your strategies without the pressure of risking large sums of money. For example, starting with a small amount like $500 helps you practice risk management and build your trading skills without significant financial stress.
Today, we covered the essentials of intraday trading, from understanding market hours and choosing the right broker to learning key strategies and advanced technical analysis techniques. We also discussed practical tips like setting realistic goals, risk management, and the importance of continuous learning.
We hope this blog adds value to your trading journey and helps you on your way to becoming a successful trader.
Do check out our other articles:
Intraday trading, also known as day trading, involves buying and selling financial instruments like stocks, commodities, or currencies within the same trading day. The goal is to profit from short-term price movements. Unlike long-term investing, where positions are held for months or years, intraday traders close all their trades before the market closes to avoid overnight risk.
The best times for intraday trading are typically during the first hour after the market opens and the last hour before it closes. These periods are known for higher volatility and trading volume, providing more opportunities for price movements. For example, in the U.S., trading from 9:30 AM to 10:30 AM and from 3:00 PM to 4:00 PM Eastern Time are often the most active times.
To learn intraday trading, you can take several steps. Start by taking online trading courses, as many platforms offer courses on trading strategies and technical analysis. Reading books on day trading can also provide valuable insights into the basics and advanced strategies. Practicing with a demo account allows you to hone your skills without risking real money. Joining trading communities can be beneficial, as engaging with other traders through forums and social media allows you to share insights and experiences. Staying informed by keeping up with market news, trends, and economic indicators that impact the markets is essential for ongoing learning and improvement.
To start intraday trading, you need a few essential tools. First, a reliable trading platform with real-time data and advanced charting tools is crucial for executing trades and analyzing the market. Charting software helps you analyze price movements and identify trading opportunities. Staying updated with market news and events that can impact prices is essential, so subscribing to news services is beneficial. High-speed internet ensures fast and uninterrupted access to market data and execution of trades. Lastly, a demo account is valuable for practicing your strategies without risking real money, allowing you to build confidence and refine your trading techniques.
Look for stocks with high trading volume and volatility, as they offer better liquidity and more price movement. Keep an eye on stocks in the news, as they often show increased activity. Use technical indicators like moving averages, RSI, and MACD to identify potential trading opportunities.

ETTFOS brings over 35 years of trading experience to deliver well-researched, educational content designed to enhance your understanding of the financial markets. Our blog covers key market insights and trading concepts to help you stay informed and sharpen your skills. Follow us for expert updates and in-depth articles.