There are thousands of trading indicators available, each serving a specific purpose such as trend identification, predicting market movements, finding entry and exit points, and more. Traders use indicators based on their trading style and preferences, integrating them into their trading plans. Despite the variety of indicators, there are some common ones that most traders use.
In this blog post, we will explore the top five trading indicators that every trader should know. These indicators are widely used and can provide valuable insights into market trends and potential trading opportunities. Let’s dive in!
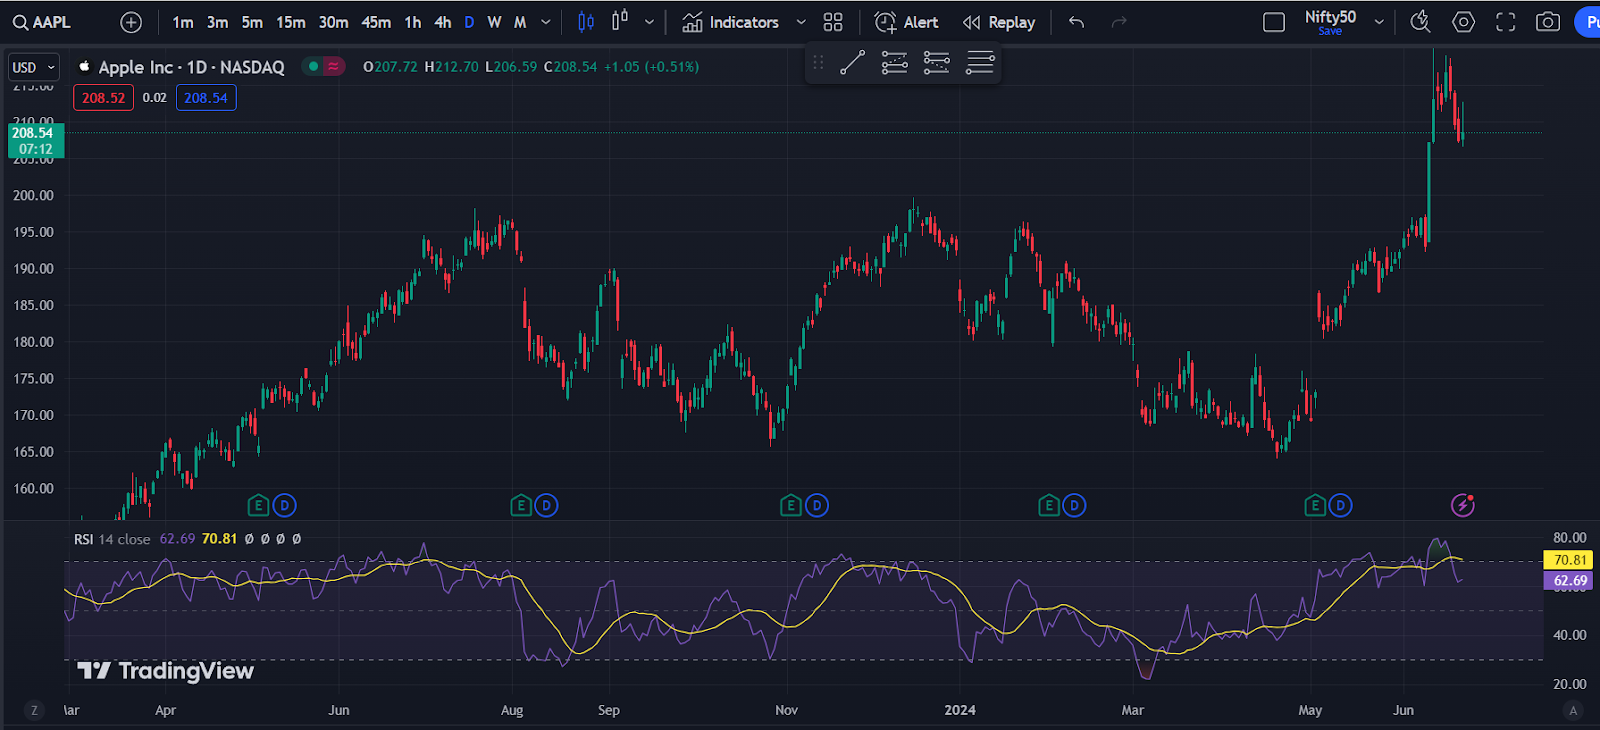
The Relative Strength Index (RSI) is a tool used by traders to measure the strength of a price trend. It ranges from 0 to 100 and is typically used to identify overbought or oversold conditions in the market. When the RSI is above 70, it indicates that a stock may be overbought, and when it’s below 30, it may be oversold.
Traders use the RSI to help them make decisions about buying or selling stocks. For example, if the RSI of a stock is above 70, a trader might consider selling their shares because it could mean the stock is overvalued and due for a price decrease. Conversely, if the RSI is below 30, a trader might consider buying shares because it could mean the stock
is undervalued and due for a price increase.
Fibonacci retracement is a popular tool used by traders to identify potential levels of support and resistance in a market. This tool is based on the Fibonacci sequence, a mathematical concept that is found in nature and often used in trading to predict price levels.
To apply Fibonacci levels in trading, traders first identify a significant price movement, known as a swing high and swing low. They then draw Fibonacci retracement levels from the swing low to the swing high, or vice versa. These levels, which are at 23.6%, 38.2%, 50%, 61.8%, and 100% of the price move, are potential areas where the price could reverse or consolidate.
Traders use Fibonacci retracement levels to help them determine potential entry and exit points for their trades. For example, if a stock is in an uptrend and retraces to the 50% Fibonacci level, traders might see this as a buying opportunity, as the stock could bounce back up from this level. Conversely, if a stock is in a downtrend and retraces to the 61.8% Fibonacci level, traders might see this as a selling opportunity, as the stock could reverse and continue its downtrend from this level.

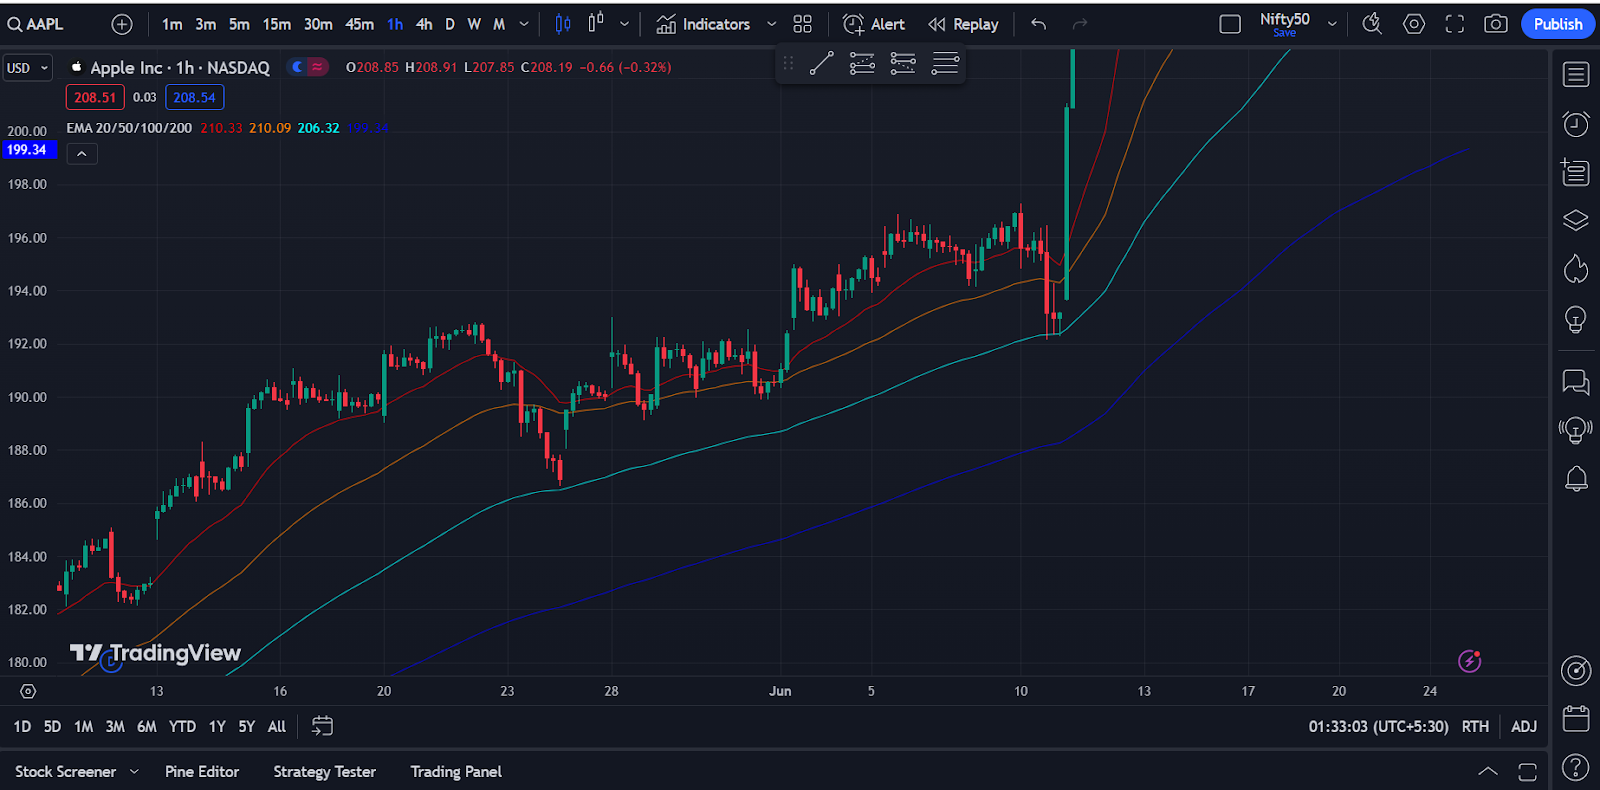
Moving averages are essential tools for traders to smooth out price data and identify trends. There are two main types of moving averages: Simple Moving Average (SMA) and Exponential Moving Average (EMA).
Simple Moving Average (SMA): SMA is calculated by adding up the closing prices of a security over a specific period (e.g., 10 days) and then dividing by the number of periods. This provides a simple average of the security’s price over that time frame.
Exponential Moving Average (EMA): EMA gives more weight to recent prices, making it more responsive to recent price changes compared to the SMA. It is calculated by giving a higher weight to the most recent price and decreasing the weight for older prices.
Traders use moving averages to identify trends and make trading decisions. When the price is above the moving average, it is considered an uptrend, and when it is below, it is considered a downtrend. Traders also look for crossovers between different moving averages, such as the 50-day and 200-day moving averages, as potential trading signals.
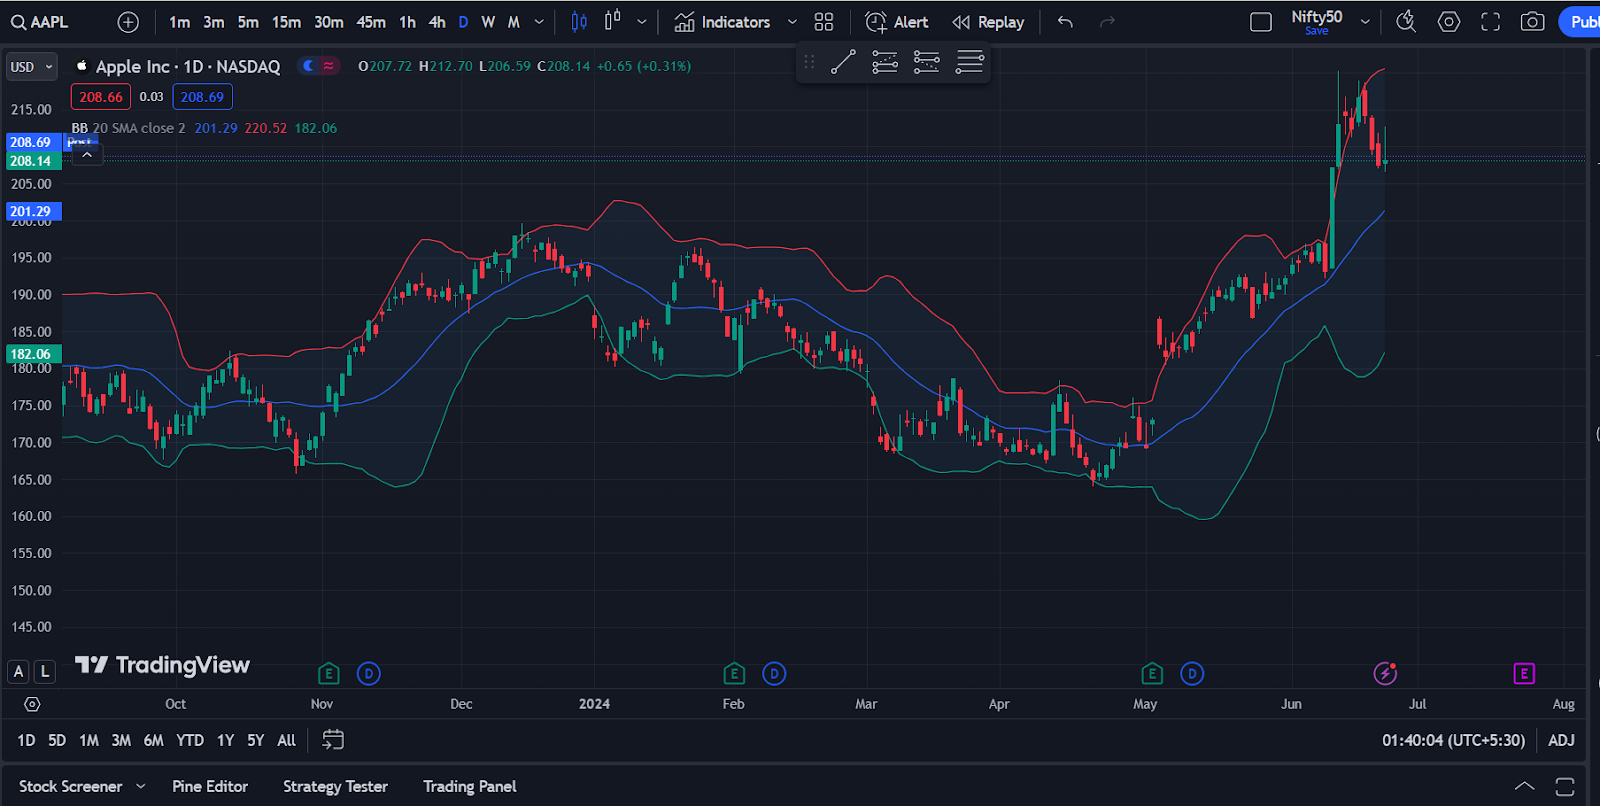
Bollinger Bands are a technical analysis tool that consists of a moving average (typically a 20-period simple moving average) and two standard deviations plotted above and below the moving average. These bands expand and contract based on market volatility, providing traders with a visual representation of price volatility.
Traders use Bollinger Bands to measure market volatility and identify potential breakout points. When the bands contract, it indicates low volatility, suggesting that a breakout may be imminent. Conversely, when the bands expand, it indicates high volatility, suggesting that a strong trend may be forming.
Traders also look for price action near the bands to identify potential trading opportunities. For example, if the price touches the upper band and then starts to move back towards the moving average, it could signal a potential reversal. Similarly, if the price touches the lower band and then starts to move back towards the moving average, it could signal a potential reversal to the upside.
The Moving Average Convergence Divergence (MACD) is a trend-following momentum indicator that shows the relationship between two moving averages of a security’s price. It consists of three main components: the MACD line, the signal line, and the histogram.
MACD Line: The MACD line is calculated by subtracting the 26-period Exponential Moving Average (EMA) from the 12-period EMA. It represents the difference between the two EMAs and is used to identify changes in trend.
Signal Line: The signal line is a 9-period EMA of the MACD line. It is used to generate buy and sell signals. When the MACD line crosses above the signal line, it is considered a bullish signal, indicating a potential uptrend. Conversely, when the MACD line crosses below the signal line, it is considered a bearish signal, indicating a potential downtrend.
Histogram: The histogram represents the difference between the MACD line and the signal line. It is used to visualize the relationship between the two lines and can help traders identify trend reversals and momentum.
Traders use the MACD to identify trend reversals and momentum. When the MACD line crosses above the signal line, it is considered a bullish signal, suggesting that the price may continue to rise.
Conversely, when the MACD line crosses below the signal line, it is considered a bearish signal, suggesting that the price may continue to fall. Traders also look for divergences between the MACD and the price action, as these can indicate potential trend reversals.

These five trading indicators—Relative Strength Index (RSI), Fibonacci Retracement, Moving Averages, Bollinger Bands, and Moving Average Convergence Divergence (MACD)—are powerful tools for traders.
They can help you identify trends, measure market volatility, and spot potential breakout points. By incorporating these indicators into your trading strategy, you can make more informed decisions and improve your overall trading performance. Whether you’re a novice trader or an experienced investor, these indicators can help you navigate the markets with confidence.
We hope you’ve gained valuable insights from this blog. If you’re looking to master trading, be sure to check out ETTFOS Trading Masterclass, where our 20+ years of experience can help you develop backtested systems for a competitive edge in the market.

ETTFOS brings over 35 years of trading experience to deliver well-researched, educational content designed to enhance your understanding of the financial markets. Our blog covers key market insights and trading concepts to help you stay informed and sharpen your skills. Follow us for expert updates and in-depth articles.