Today, we’re going to dive into the fundamentals of technical analysis—something that every trader needs to understand if they want to make smart decisions in the market. Technical analysis is all about studying price movements and patterns to get a better read on where the market might be headed next. It’s not about predicting the future with 100% certainty, but it gives you the tools to improve your odds.
Whether you’re a day trader, swing trader, or even a long-term investor, knowing how to read charts, spot trends, and use indicators can be the difference between making a profit or taking a loss. And with so many people jumping into the market today, mastering these key concepts is what will set you apart from the crowd.
In this guide, we’ll break down the core ideas behind technical analysis—things like price charts, support and resistance, trend lines, moving averages, and indicators. By the end, you’ll have a clear understanding of what they are and how you can start using them in your trading right away.
Technical analysis is a method traders use to evaluate and predict market movements by analyzing historical price data and chart patterns. Unlike fundamental analysis, which focuses on a company’s financial health or the overall economic environment, technical analysis is all about reading the market’s behavior directly through price action and volume. Traders use it to identify trends, key levels of support and resistance, and signals for when to enter or exit trades.
The real power of technical analysis lies in its ability to work across all timeframes and assets—whether you’re trading stocks, forex, or crypto. It doesn’t matter if you’re looking at a 5-minute chart or a daily chart; the same principles apply. This makes it a go-to tool for traders who rely on price patterns and market psychology to make their decisions. Technical analysis helps traders take the emotion out of trading by focusing purely on what the market is doing, not what they think it should do.
For anyone serious about trading, mastering technical analysis is essential. It gives you the ability to respond to market conditions in real-time and make decisions based on data rather than guesswork.
Now, let’s dive into the core concepts of technical analysis that every trader needs to understand. These are the building blocks that will help you analyze the markets effectively and make informed trading decisions based on price action and market behavior.
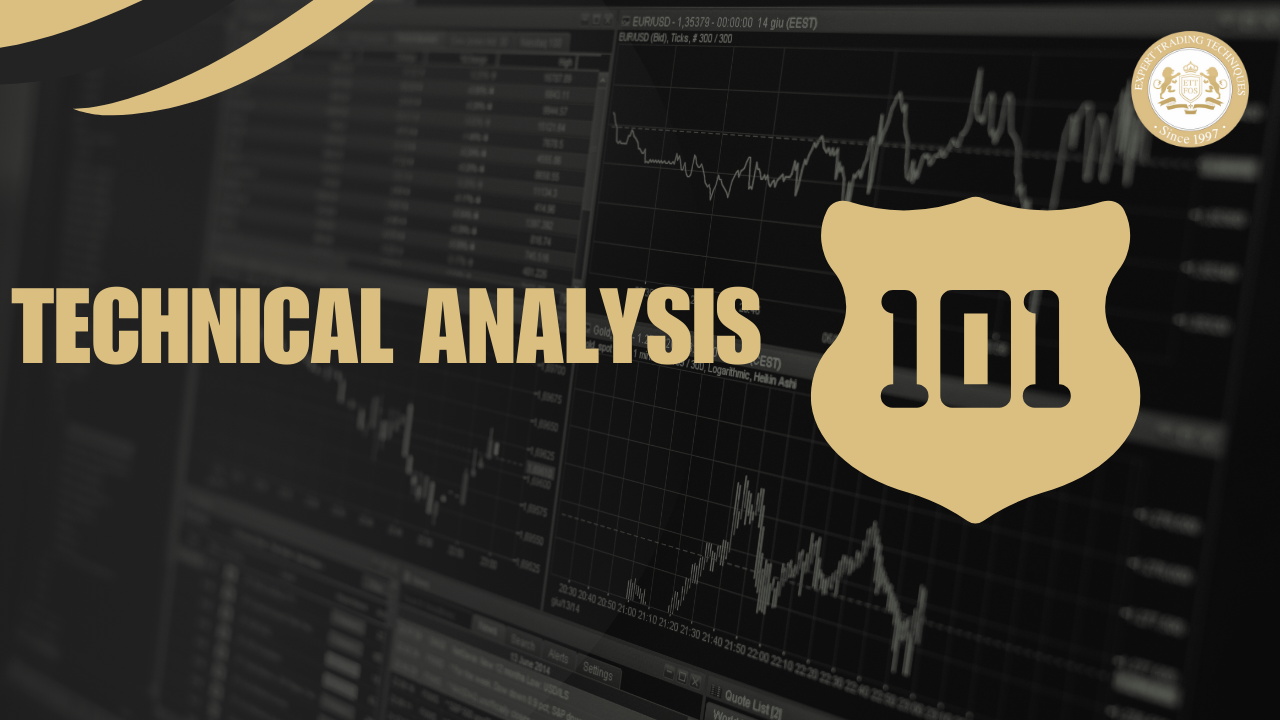
Price charts are the foundation of technical analysis. They are visual representations of an asset’s price over time, allowing traders to analyze historical data to identify trends and patterns. There are three main types of charts: line charts, bar charts, and candlestick charts.
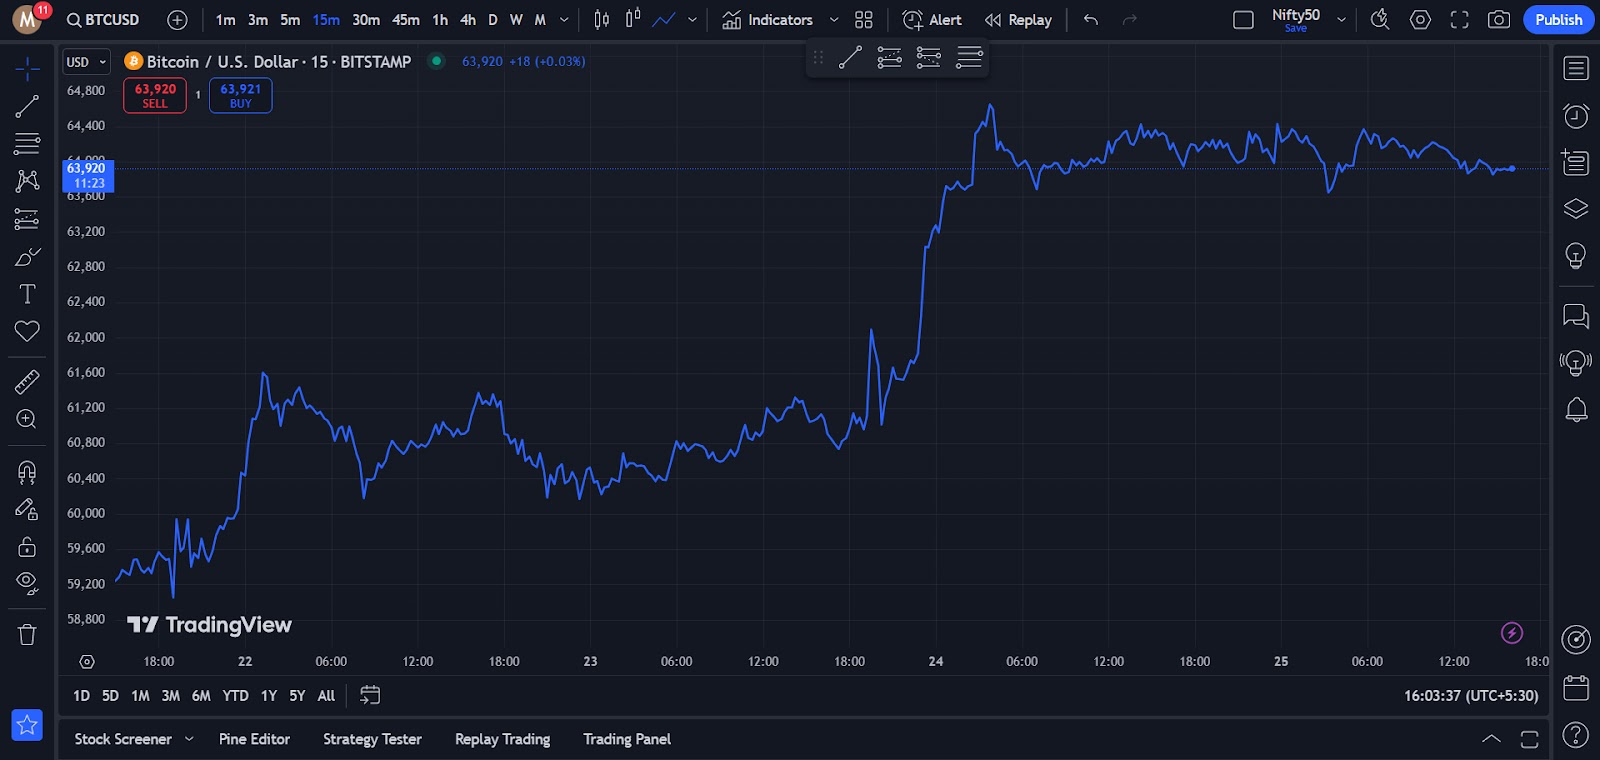
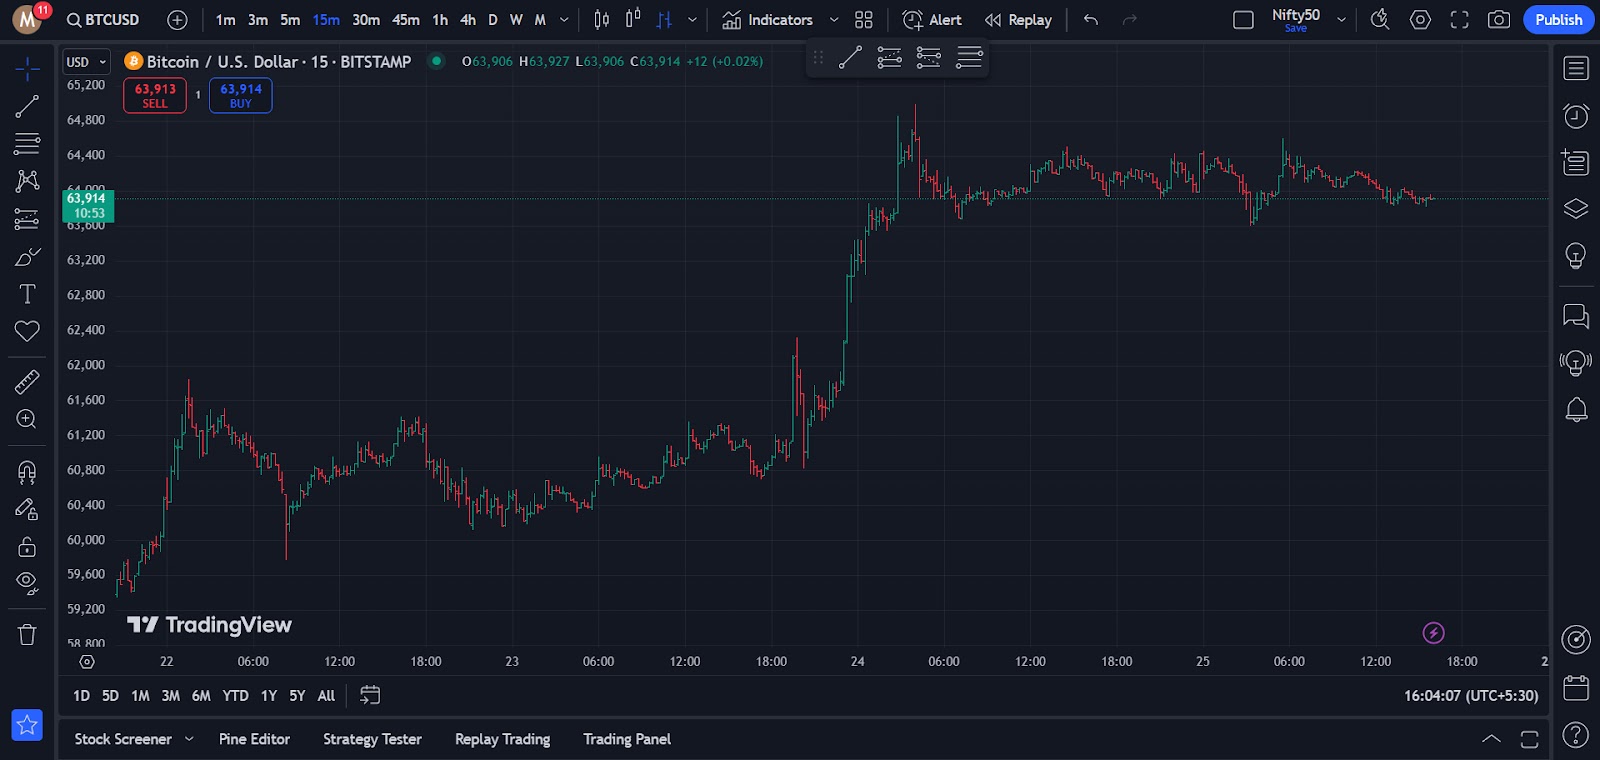
Candlestick charts are particularly valued because they offer a balance between simplicity and depth of information, making them essential for identifying key market moves.
Support and resistance are critical concepts that help traders understand where the price might change direction. Support is a price level where an asset tends to stop falling because demand starts to outstrip supply. On the other hand, resistance is a level where the price tends to stop rising due to increasing selling pressure. These levels are significant because they often act as barriers that the price has difficulty breaking through.
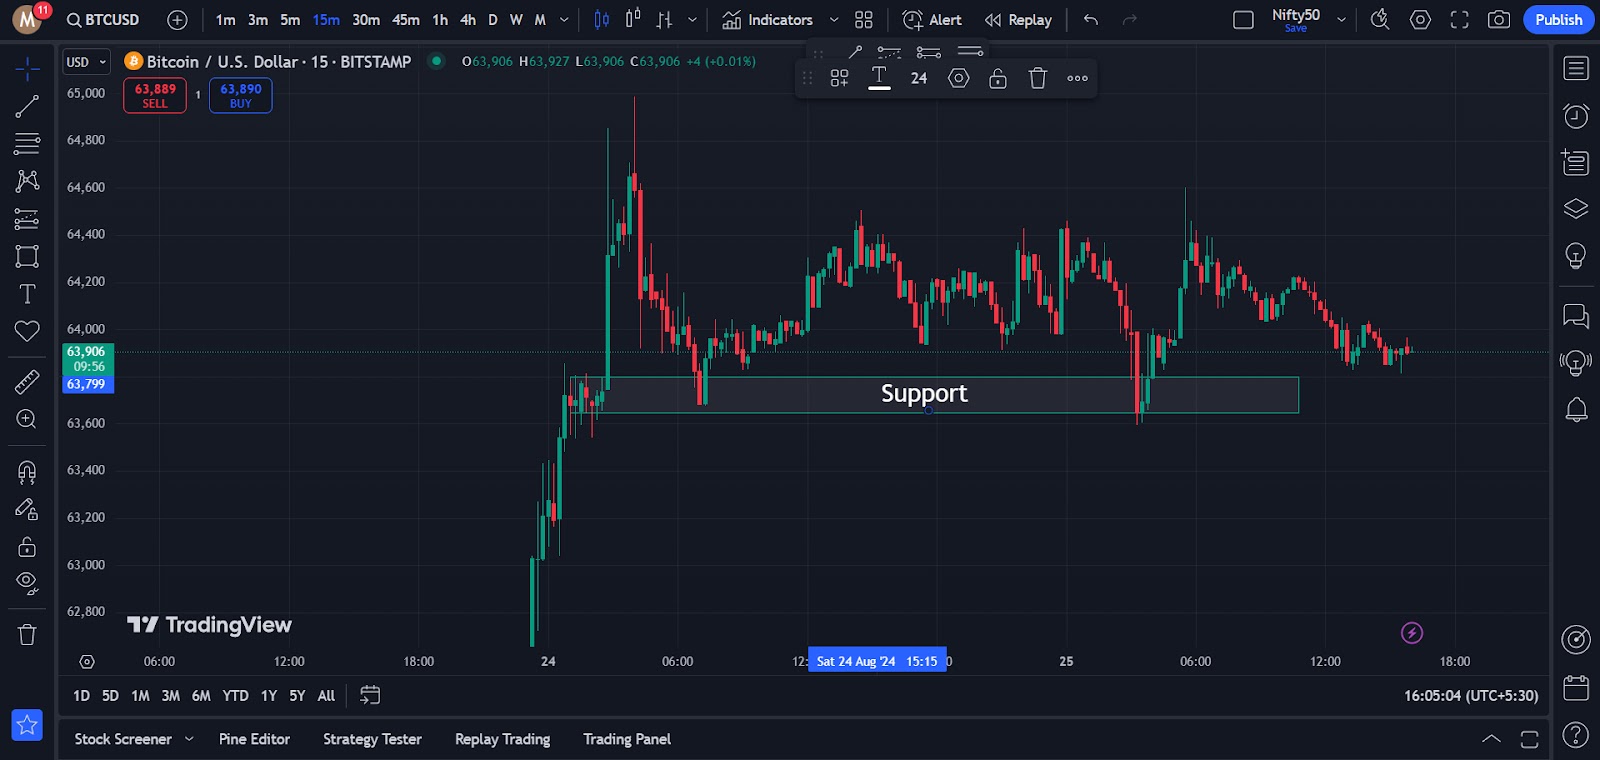

Traders use these levels to make decisions about entry and exit points. For instance, buying near support with a stop-loss below it or selling near resistance with a stop above it are common strategies.
Trend lines are straight lines drawn on price charts to help traders visualize the direction of the market. They are simple yet powerful tools used to identify trends, which can either be upward, downward, or sideways (range-bound).
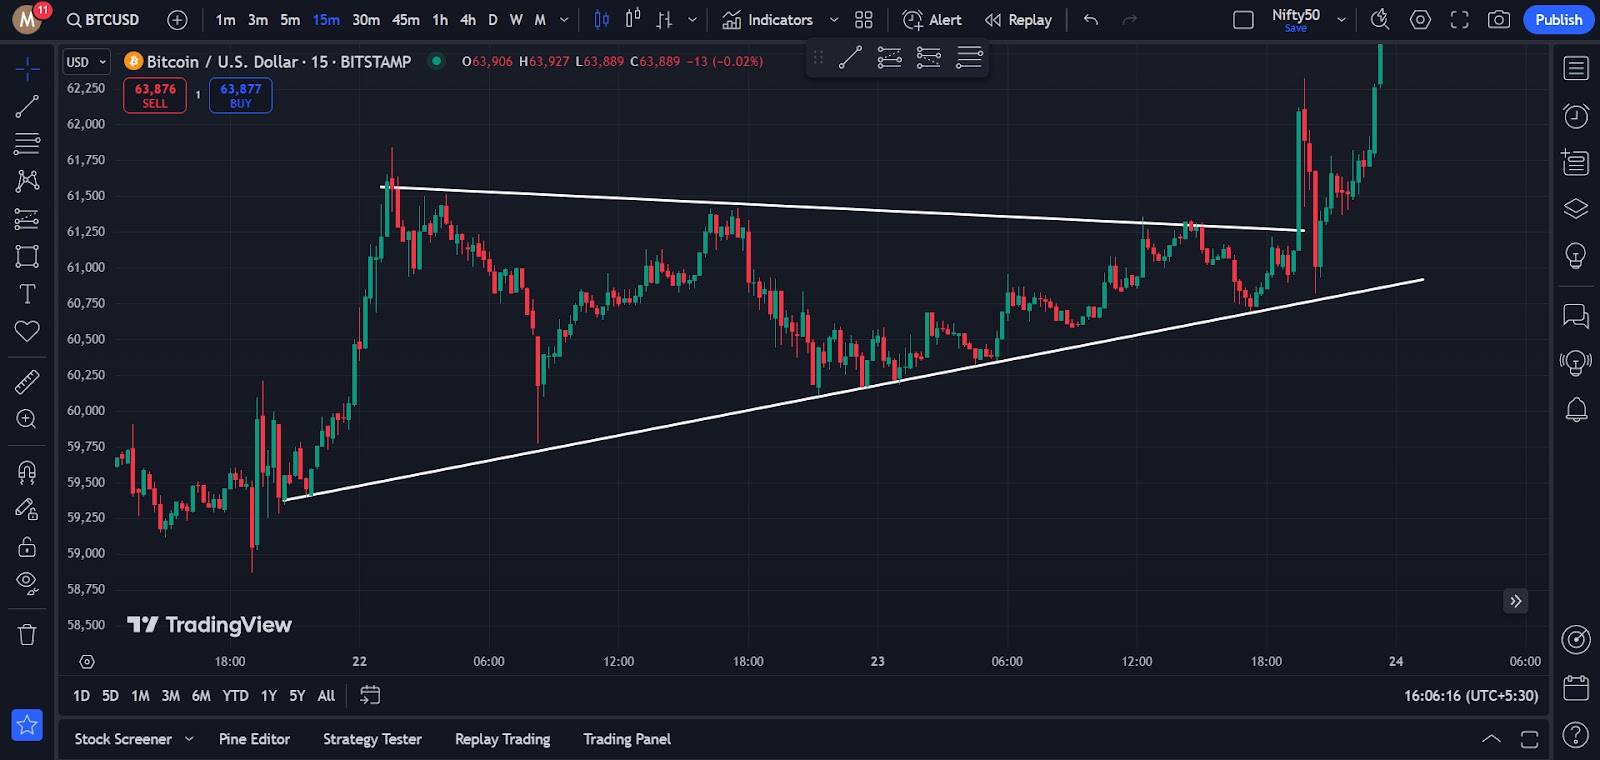
Trend lines help traders stay on the right side of the market by keeping them aligned with the overall direction rather than fighting against it.
Moving averages are among the most commonly used tools in technical analysis. They smooth out price data to create a single flowing line that helps traders identify the overall direction of the market. There are two main types: Simple Moving Average (SMA) and Exponential Moving Average (EMA).
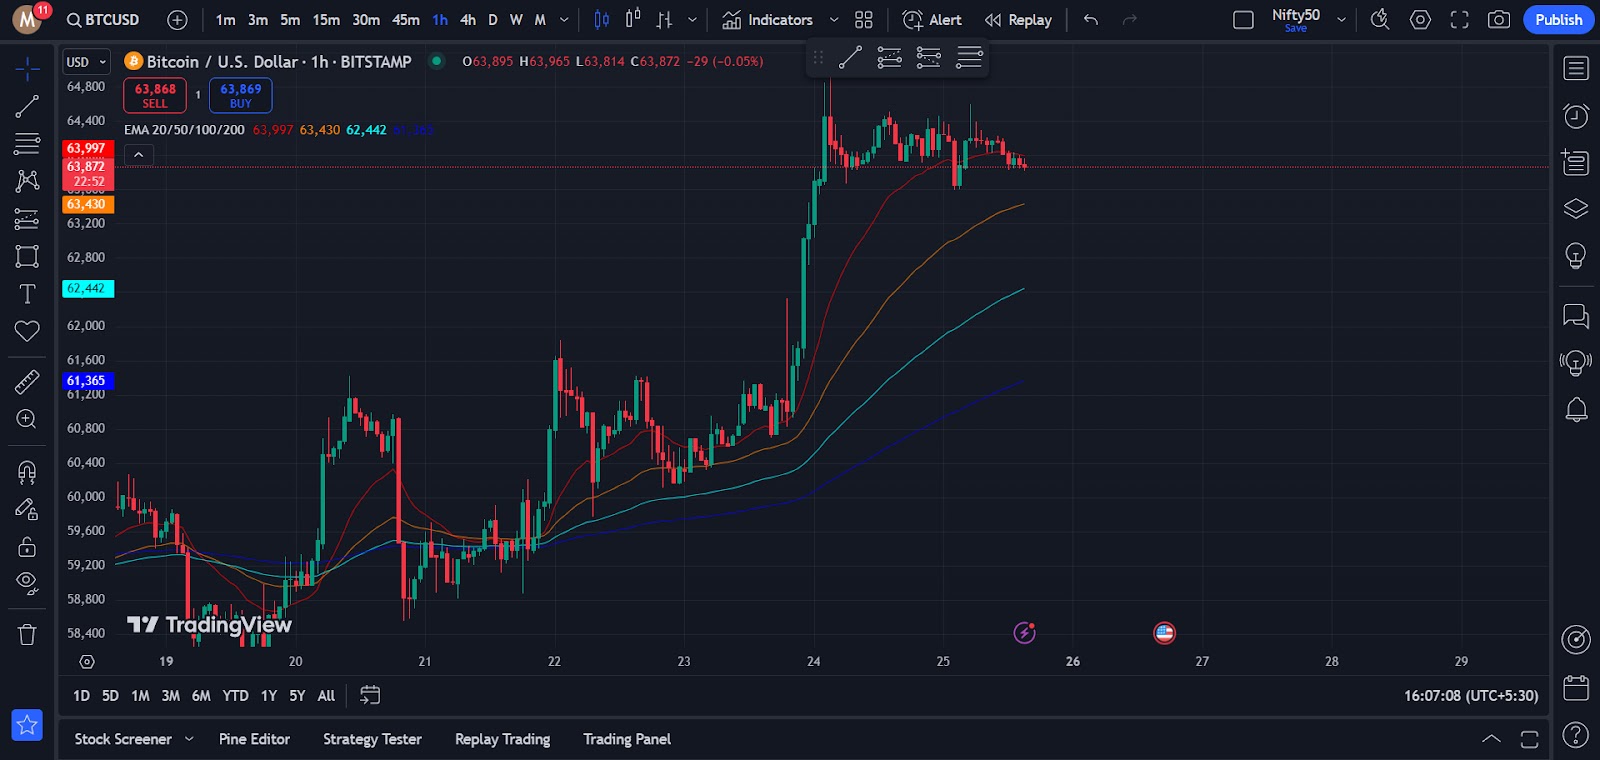
Moving averages also act as dynamic support and resistance levels, helping traders spot areas where the price might bounce or reverse.
Indicators and oscillators are technical tools that help traders gauge the momentum of an asset. While there are countless indicators, some of the most popular ones include the Relative Strength Index (RSI), Moving Average Convergence Divergence (MACD), and Bollinger Bands.
Chart patterns are graphical representations that form over time on price charts. They are used by traders to predict future price movements based on historical behavior. Chart patterns are classified into two main types: reversal patterns and continuation patterns.
Understanding chart patterns can help traders anticipate where the market is likely to go next, offering them valuable insight for trade entries and exits.
Volume analysis is a critical part of technical analysis because it tells traders about the strength of a price movement. Simply put, volume is the number of shares or contracts traded in a security over a period of time. Analyzing volume helps traders confirm trends and potential reversals.
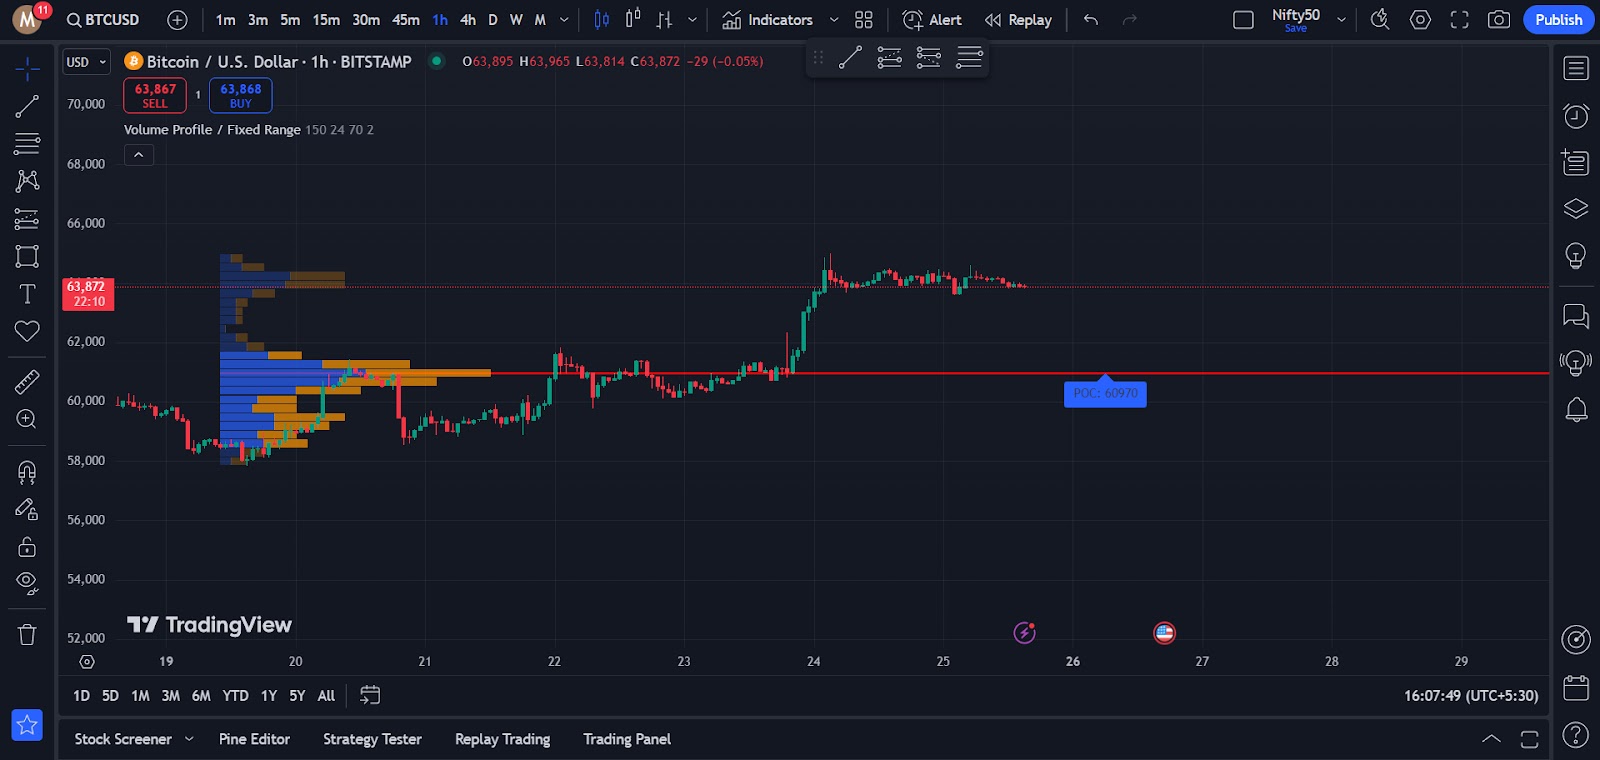
Volume analysis adds an extra layer of confirmation to technical setups and is especially useful in identifying the strength of trends or predicting breakouts
In this guide, we covered the essential concepts of technical analysis—everything from reading price charts to identifying trends, using indicators, and analyzing volume. These tools are the backbone of successful trading, helping you make smarter decisions and manage your risk better.
Want to take your skills to the next level? Join ETTFOS’s Trading Masterclass, where you’ll learn directly from experts with over 30 years of experience in trading and training. Our masterclass dives deep into technical analysis, teaching you how to apply these concepts in real markets with proven strategies. Don’t miss the opportunity to learn from seasoned traders and sharpen your edge!
The most important concept in technical analysis is understanding price action. Price action represents the movement of an asset’s price over time and forms the basis for all other technical tools, such as support and resistance levels, trend lines, and chart patterns.
The time frame you choose should align with your trading style. For day traders, shorter time frames like 1-minute or 5-minute charts are common. Swing traders often use daily or 4-hour charts, while long-term investors may look at weekly or monthly charts. Your time frame should match your risk tolerance and how frequently you want to trade.
Moving averages are useful for identifying trends and potential reversals, but they should be used in conjunction with other indicators. A moving average by itself may lag behind the market, so combining it with tools like trend lines or oscillators can give you a clearer picture.
Yes, technical analysis can be applied to any asset class, including stocks, forex, cryptocurrencies, commodities, and more. Since it focuses on price action and volume, it works well across different markets and time frames.
To confirm a breakout, look for high trading volume accompanying the price move. If the breakout happens with strong volume, it’s more likely to be genuine. Additionally, using indicators like the Relative Strength Index (RSI) or On-Balance Volume (OBV) can help verify the breakout’s strength.
Support is a price level where demand is strong enough to prevent the price from falling further, while resistance is a level where selling pressure is strong enough to prevent the price from rising. These levels help traders identify potential entry and exit points.
Neither is inherently better; they are simply different approaches. Technical analysis focuses on price action and market trends, while fundamental analysis looks at the underlying financial health of an asset. Many traders use a combination of both to make more informed decisions.

ETTFOS brings over 35 years of trading experience to deliver well-researched, educational content designed to enhance your understanding of the financial markets. Our blog covers key market insights and trading concepts to help you stay informed and sharpen your skills. Follow us for expert updates and in-depth articles.