Table of Contents
ToggleSwing trading is a popular strategy for those looking to profit from short-term changes in stock prices. It involves capturing gains from stock movements that usually last a few days to a few weeks.
In this blog, we’re going to cover everything about swing trading. We’ll start with the basics, explaining how it works and how it’s different from other trading methods. Then, we’ll discuss the tools and strategies that can help you succeed. Our goal is to provide clear, practical advice that will help you start swing trading with confidence.
Swing trading is a trading strategy where you aim to profit from short-term price movements in stocks over a period of a few days to several weeks. Instead of holding stocks for the long term or trading several times a day, swing traders look for patterns or trends that suggest a stock’s price is about to rise or fall and then act on these insights.
This type of trading offers more flexibility than intraday trading, which demands that all positions are closed by the end of the market day. With swing trading, you can hold positions overnight or longer. Swing trading also differs from long-term investing, where the focus is usually on the potential for gradual appreciation over years. Instead, swing traders focus on capturing gains from short-term trends and movements, without the need for deep analysis into a company’s long-term prospects.
For busy businessmen and professionals who can’t afford to monitor the stock market every moment but still wish to actively invest and maintain their day jobs, swing trading is an appealing option. It allows for active engagement in the market without requiring constant attention, enabling you to balance trading with other professional and personal commitments efficiently.
Let’s understand how swing trading works with an example. Imagine a trader notices that the stock price of Netflix typically rises after the company announces a new series. The trader decides to buy shares a few days before the next anticipated series announcement and plans to sell them shortly after the release, when the stock price usually peaks.
Now, consider a technical analysis example. Suppose a trader observes that every time Amazon’s stock price reaches $3,000, it tends to bounce back up after briefly touching this level. This pattern, known as a “support level,” suggests that $3,000 is a strong price point where many buyers are willing to enter the market, preventing the stock from falling lower. The trader uses this information to buy shares the next time the price approaches $3,000, expecting it to increase again, and plans to sell when the price reaches around $3,200, a previous “resistance level” where the stock historically struggles to rise further.
These examples highlight the essence of swing trading, which is to capitalize on predictable short-term upward or downward movements in stock prices. Traders aim to buy stocks at the start of an upward trend and sell them before the trend reverses. Swing trading requires careful analysis of stock charts to identify trends and patterns, like support and resistance levels. Swing trading is perfect for those who want to engage in active trading without the need to constantly monitor the market all day.
Technical analysis plays a huge role in swing trading. Let’s look at some of the most common swing trading strategies traders use to identify potential price movements and make informed trading decisions.
Support and Resistance Levels: These are key price levels where a stock often reverses its direction. For example, if Tesla’s stock price repeatedly falls to $600 and then rises, $600 is a support level. Similarly, if the stock often peaks at $700 before falling, $700 is a resistance level. Identifying these levels helps traders decide when to buy or sell.

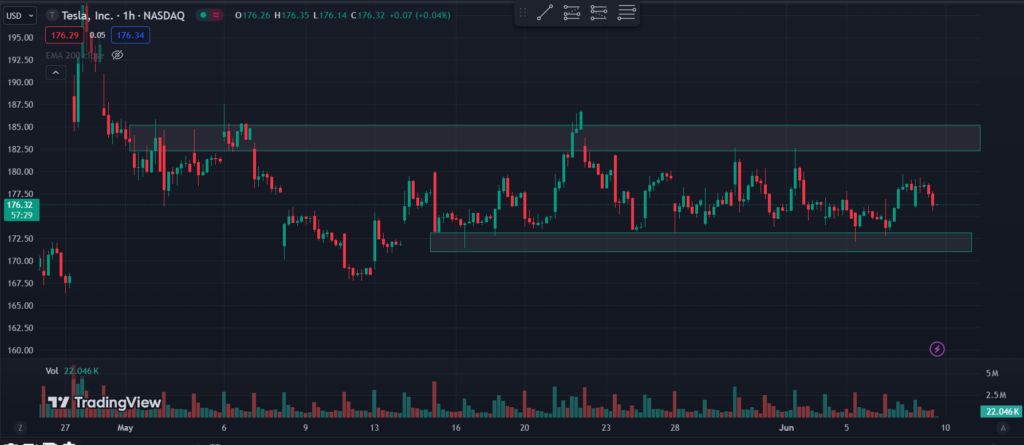
As you can see in the provided chart, Tesla’s stock appears to be finding support around the $170 mark and facing resistance around the $180 mark. It’s important to note that this is a simplified example for demonstration purposes. In real trading scenarios, you would typically use multiple confirmations to make more informed decisions. This might include looking at additional technical indicators, analyzing market conditions, or considering economic factors that could influence stock prices.
Chart Patterns and Channels: Patterns like triangles, flags, and channels help predict future price movements. For example, an ‘ascending triangle’ forms when a stock’s price hits resistance at the same level but creates higher lows over time.
This pattern often indicates a potential breakout above the resistance level. Channels, where prices move within parallel lines, help traders buy at the lower boundary and sell at the upper boundary.
Fibonacci Retracements: Traders use Fibonacci levels to predict where a stock might retrace before continuing its trend. For instance, if Apple’s stock rises from $120 to $150, traders might look for it to pull back to 61.8% of that rise (around $132) before it continues climbing.
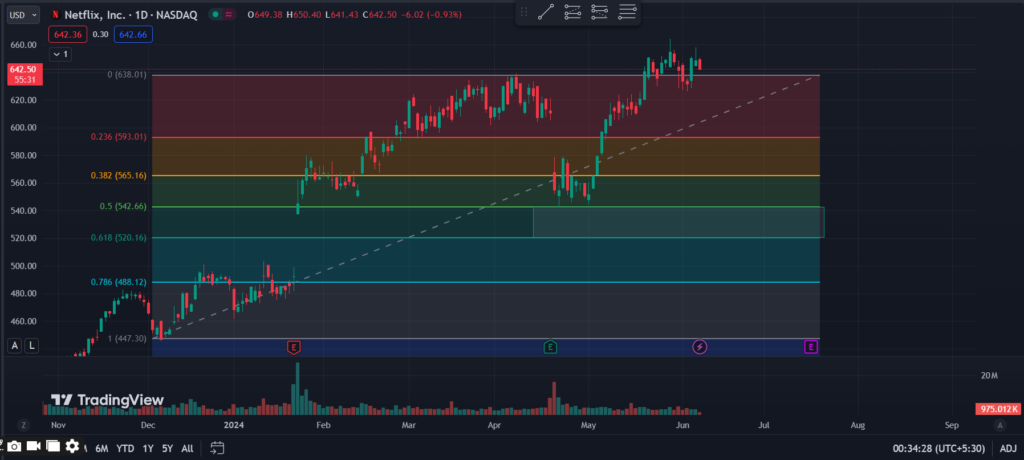
For instance, let’s examine Netflix’s stock price movement on the chart. The stock rose from a low of $447 to a high of $640. Following this rise, it experienced a retracement back to around $540. By applying the Fibonacci retracement indicator to this price movement, we can see that the stock pulled back into what’s often referred to as the “golden zone” — typically around the 61.8% Fibonacci level.

In the case of Netflix, after reaching this key Fibonacci level, the stock resumed its upward trend. This type of movement is a classic example of how traders can use Fibonacci retracements to identify potential points to enter a swing trade. Understanding how these levels work and combining this knowledge with other trading confirmations (like volume analysis, RSI, or MACD) can help traders capitalize on such opportunities by entering the market at potentially advantageous positions.
Pivot Points: Calculated from the previous day’s high, low, and closing prices, pivot points indicate potential support and resistance levels for the current day. For example, if today’s price stays above the pivot point, it could suggest a bullish trend.
Exponential Moving Averages (EMA): EMAs give more weight to recent prices and help identify trends. A popular strategy is to use the 50-day and 200-day EMAs. When the 50-day EMA crosses above the 200-day EMA, it’s a bullish signal, suggesting it might be a good time to buy.
Let’s Look at a Practical Example:
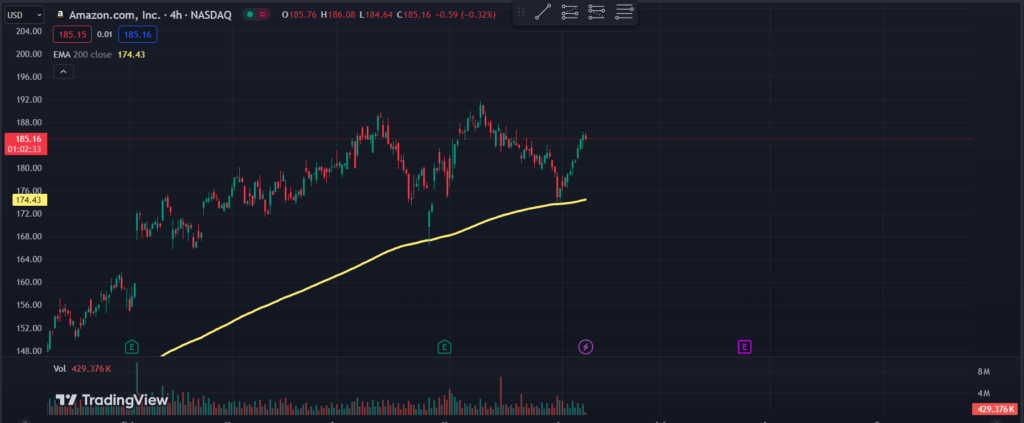
Consider the Amazon stock chart as an example to understand how moving averages can guide trading decisions:

On June 3rd, the chart indicates that Amazon’s stock price touched the 200-day moving average line and then began to climb. This point acts as a support level — a price at which the stock tends not to fall below.

After reaching this support, the stock price increased by 6% within the following week. This rapid rise after meeting the 200-day moving average could suggest that the stock is gaining upward momentum.
In this scenario, the 200-day moving average served as a key indicator that Amazon’s stock might rise, which it indeed did shortly thereafter. For traders, observing these moving average crossovers could assist in deciding when to buy the stock. However, it’s important to corroborate such signals with other indicators and analysis methods to minimize risks. Additional factors like trading volume, current market news, and other technical indicators can provide a fuller picture of whether it’s an optimal time to make a purchase.
Divergence: Divergence occurs when the price of a stock moves in the opposite direction of an indicator like the Relative Strength Index (RSI). For instance, if a stock’s price is making lower lows but the RSI is making higher lows, it might indicate that the downtrend is losing momentum and a reversal could be imminent.
You can explore these strategies more in-depth and create a swing trading plan that will give you an edge in the market.
Finding the right stocks for swing trading is all about looking at a few key things: volume, liquidity, and momentum. Volume means how many shares are being traded. You want stocks with high volume because it’s easier to buy and sell them quickly. Liquidity is how easily you can buy or sell a stock without changing its price too much. For example, if you want to trade Microsoft, you might see it has a lot of daily trades, which means you can buy or sell shares without much trouble. This makes Microsoft a good choice for swing trading because you can get in and out of the trade easily.
To find these stocks, you can use tools like watchlists and stock screeners. A watchlist is a list of stocks you are interested in and want to keep an eye on. Stock screeners are tools that let you search for stocks based on criteria you set, like high volume or specific price ranges. For example, you could use a stock screener to find stocks that trade over 1 million shares a day and are priced between $20 and $100. This helps you focus on stocks that are good for swing trading.
We have an in-depth blog on this topic, which you can check out here: How to Find Stocks for Swing Trading.
Swing trading has its own set of risks and benefits that traders should consider before getting started. One of the key benefits is the potential for quick profits. Because swing traders hold stocks for a few days to a few weeks, they can take advantage of short-term price movements. This means you can make money faster than with long-term investing, where you might have to wait years to see significant gains. For example, if you buy a stock that suddenly jumps in price due to good news, you can sell it quickly and lock in your profits.
High liquidity is another advantage of swing trading. Liquidity refers to how easily you can buy or sell a stock without affecting its price. Stocks with high liquidity, like those of big companies, are easier to trade. This is important for swing traders because it means you can enter and exit positions quickly, taking advantage of short-term price movements without worrying about not being able to sell your shares.
However, swing trading also comes with risks. Managing lower risk exposure is crucial because holding stocks for a short period can be unpredictable. Prices can change rapidly due to market news or other factors, which can lead to unexpected losses. To manage these risks, swing traders often use stop-loss orders, which automatically sell a stock if its price falls to a certain level. This helps limit losses and protect your investment.
So, while swing trading offers the potential for quick profits and benefits from high liquidity, it also requires careful risk management. You need to be aware of the risks and have strategies in place to protect their investments. Understanding these aspects can help you make more informed decisions and improve your chances of success in swing trading.
When starting with swing trading, it’s important to set realistic goals. Begin with small trades to learn how the market works. For example, you might aim to make a 5% profit on a trade rather than trying to double your money quickly. By setting specific targets, you can stay focused and avoid taking unnecessary risks. Remember, not every trade will be a winner. It’s essential to be patient and think long-term. Small, consistent gains can add up over time.
Managing risk is crucial in swing trading. One effective way to do this is by using stop-loss orders. For example, if you buy a stock at $50, you can set a stop-loss at $45. This means if the stock price drops to $45, your stock will be sold automatically, limiting your loss. Diversifying your trades is also important. Instead of putting all your money into one stock, spread it across different stocks to reduce risk. Only trade with money you can afford to lose and set a limit on how much you are willing to risk on each trade.
Keeping a trading journal can help you become a better trader. Write down every trade you make, why you made it, and what the outcome was. For example, if you bought shares of Amazon because you noticed a positive earnings report, note that down. Reviewing your journal regularly can help you spot patterns and learn from your trading mistakes. It keeps you accountable and helps you stick to your trading plan.
Always be willing to learn more about swing trading. The market changes all the time, so it’s important to stay updated with new trends and strategies. Read books and articles about trading, and join online forums where traders share their experiences. For example, following a blog or joining a trading community can provide valuable insights. By continuously learning, you can improve your trading skills and adapt to market changes.
By following these practical tips, you can improve your swing trading skills and increase your chances of success. Stay disciplined, manage your risks, and keep learning to become a better trader.
The first step in swing trading is choosing the right broker. A good broker provides the tools and resources you need to make informed decisions. Look for brokers that offer low fees, a user-friendly trading platform, and access to research and educational materials.
Before diving into swing trading, it’s crucial to educate yourself. Understanding market basics, chart patterns, and trading strategies is essential. There are courses, books, and webinars that can help you learn the swing trading. The more you learn, the better prepared you will be to make smart trading decisions.
Practicing with simulation software, also known as paper trading, allows you to try out your strategies without risking real money. Many brokers offer simulation accounts where you can trade with virtual money. This helps you get a feel for the market and test your strategies in real-time conditions.
When you’re ready to start trading with real money, it’s important to start small. Begin with a modest amount of money that you can afford to lose. This reduces your risk while you gain experience. For instance, you might start by trading just a few shares of a stock rather than investing a large sum of money all at once. As you become more comfortable and confident in your trading strategies, you can gradually increase your investments.
Swing trading offers a way to engage with the stock market by capturing short-term price movements. Throughout this guide, we have explored various aspects of swing trading, from setting realistic goals and managing risks to the importance of keeping a trading journal and continuously learning.
We also discussed how to start swing trading by choosing the right broker, investing in trading education, practicing with simulation software, and starting with small trades. By applying these strategies and tips, you can build a strong foundation and increase your chances of success in swing trading.
If you’re ready to take the next step, start by selecting a reliable broker and educating yourself on the essentials. Practice with virtual trading accounts to test your strategies, and remember to start small as you gain experience. Stay disciplined, manage your risks, and keep learning to become a proficient swing trader.
For more detailed insights and strategies, be sure to explore our other blogs and continue enhancing your trading skills.
Happy trading!
ETTFOS brings over 35 years of trading experience to deliver well-researched, educational content designed to enhance your understanding of the financial markets. Our blog covers key market insights and trading concepts to help you stay informed and sharpen your skills. Follow us for expert updates and in-depth articles.