Swing trading involves buying and selling stocks over a short period, aiming to profit from their quick price moves. The key to success in swing trading is choosing the right stocks.
In this blog, we’ll explore simple and effective ways to find stocks for swing trading that are well-suited for this kind of trading, helping you make smarter investment decisions. We’ll walk you through the essential tools and strategies needed to pick the best stocks for swing trading. We’ll cover everything from understanding market liquidity and volume to using technical analysis and stock screeners effectively. Additionally, we’ll discuss how to analyse price momentum, identify key chart patterns, and set up your trading watchlist. By the end of this guide, you’ll have a solid foundation to start finding promising stocks for swing trading.
In swing trading, selecting the right stocks is paramount because not every stock is suitable for the quick-paced nature of this trading style. Here’s what swing traders should consider to consistently identify the best candidates:
1. Liquidity: Liquidity means how quickly and easily a stock can be bought or sold in the market without impacting its price too much. For swing trading, where timing and the ability to react swiftly are key, choosing stocks with high liquidity is essential. These stocks have large volumes of shares being traded, allowing for smoother entries and exits.
2. Volatility: Swing trading profits hinge on price movements. Therefore, it’s important that a stock shows enough volatility to provide opportunities for profit. Ideally, stocks should have moderate to high volatility, which means they move enough to create substantial trading opportunities within a few days or weeks, but not so much that their price movements become unpredictable.
3. Trend Patterns: Recognizable trend patterns make stocks more predictable and easier to trade. Swing traders often favour stocks that show a consistent uptrend or downtrend, punctuated by regular swings. Various technical analysis tools can be employed to spot these patterns, making it easier to time trades effectively.
4. Trading Volume: The amount of a stock traded on a daily basis is also a crucial indicator. High trading volume usually means there is significant interest in the stock, which can be a bullish or bearish signal. For swing traders, high volume can serve as a confirmation tool; for instance, an uptrend accompanied by increasing volume can validate a potential buy signal.
5. Fundamental Health of that Stock: Though swing trading is primarily focused on technical analysis, understanding a company’s fundamental health is important to avoid potential pitfalls. Companies with stable earnings, manageable debt, and positive growth prospects are generally more reliable. This fundamental soundness makes stocks less risky for swing trading.
6. Relative Strength Index (RSI): RSI helps measure the momentum and speed of price changes, indicating whether a stock might be overbought or oversold. For swing traders, an RSI near 70 might suggest a stock is overbought and could reverse from an uptrend, while an RSI near 30 might indicate an oversold condition ripe for a rebound.
Taking the time to carefully evaluate these criteria helps swing traders pick stocks that are likely to do well over the next few days to weeks. This careful selection is key to swing trading success, as it minimises risks and boosts your chances of good returns
In swing trading, two key factors that greatly affect your ability to trade are market liquidity and volume. Let’s look at why they are important and how you can assess them effectively.
Liquidity means how easily you can buy or sell a stock without affecting its price too much. For swing traders, who aim to profit from short-term price movements, high liquidity is critical. It allows you to enter and exit trades quickly and at prices close to the market rates. When a stock is highly liquid, it also means you’re less likely to pay a big difference between the buying and selling prices, and there’s a lower risk of getting stuck in a position because of low trading activity.
Volume shows the total number of shares traded during a certain period and is a direct indicator of a stock’s liquidity. High volume means many shares are being traded, which usually leads to better price stability and easier trade execution:
Assessing Volume: You can check the volume by looking at the average number of shares traded each day over periods like the past 10 or 30 days. This is often shown as a bar chart under the stock’s price chart on most trading platforms.
Why Volume Matters: Volume confirms if there’s enough interest in the stock at its current price, which can indicate the strength of a price movement. For example, if a stock price is going up and the volume is high, it’s more likely that the price will keep rising. This high volume suggests strong buyer interest. On the other hand, if the stock price is rising but the volume is low, the price may not sustain its climb and could drop quickly.
Swing traders should look for stocks that are not only highly liquid but also show consistent high volume. This makes it easier to enter and exit trades and ensures price movements are reliable and not just flukes. Monitoring how volume changes can also help you understand market trends better, helping you make smarter trading decisions.
Stock screeners are indispensable tools for traders, allowing them to filter stocks based on specific, user-defined metrics such as volume, EMA crossovers, and other critical indicators. These tools scan the entire stock market to identify stocks that match precise trading criteria related to volume, price levels, industry sectors, and various technical indicators.
For swing traders, the ability to quickly pinpoint stocks that meet exact trading criteria is crucial for spotting potential swing trading opportunities efficiently.
For example, if you’re interested in trading Apple stock when it takes support on the 200 EMA, stock screeners can be incredibly useful. You can set up a filter or alert in the screener to notify you via email or a direct notification when Apple’s stock price approaches or touches the 200 EMA. This setup ensures you’re informed in real-time and can make timely trading decisions based on accurate, up-to-date information.
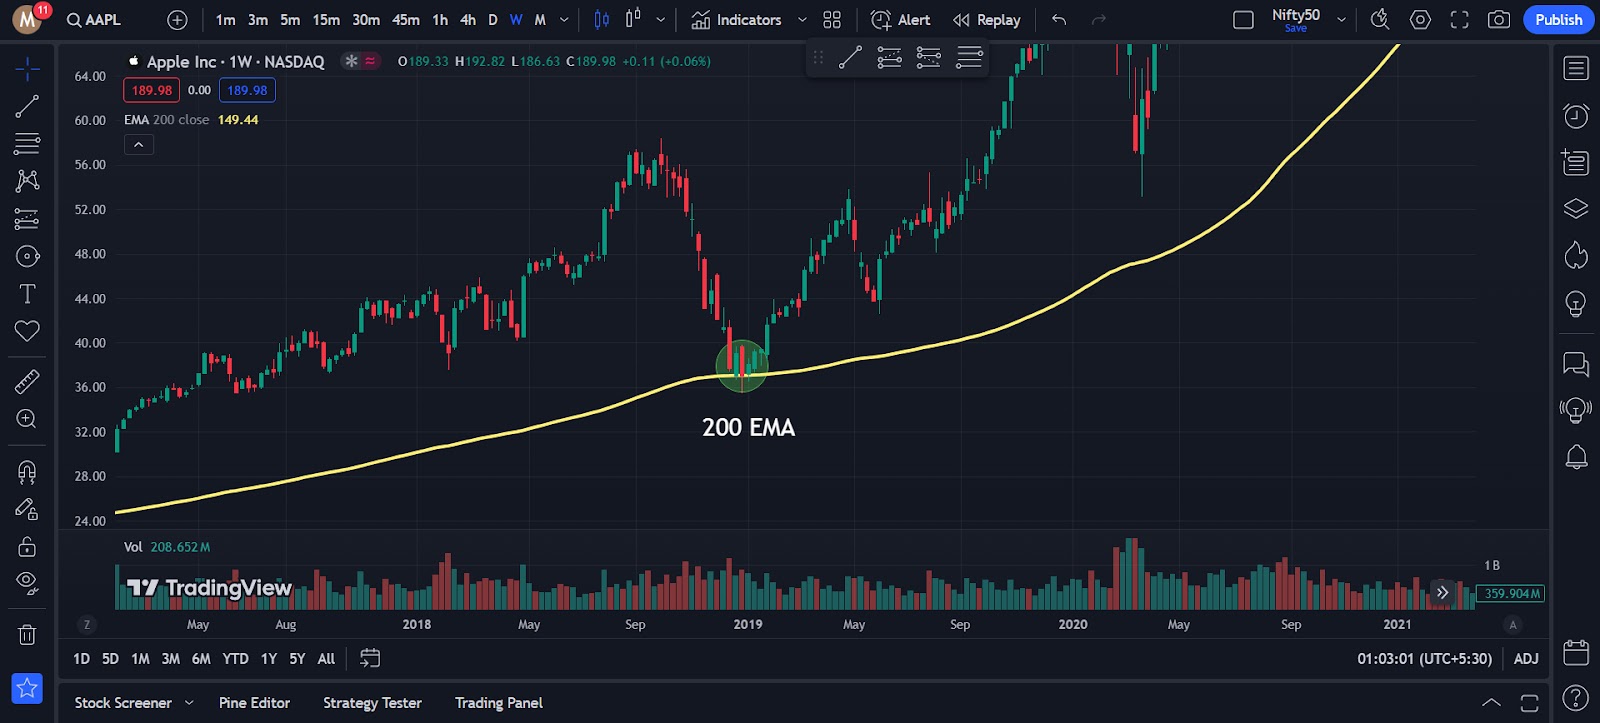
Such alerts and automated notifications help swing traders maintain an edge by allowing them to act quickly on potential trading opportunities without having to manually monitor stock movements all day. By leveraging these features, you can focus more on refining your strategies and less on the mechanics of finding trades, which enhances your efficiency and effectiveness in the market.
To find stocks suitable for swing trading, you need to set specific filters in your stock screener. Here’s how you can configure these filters:
Once you’ve pinpointed potential stocks with a stock screener, adding them to a watchlist helps you keep an eye on them over time. A watchlist is essentially a personalised list of stocks that seem promising according to your criteria but need more observation before you make any trading moves. Here’s how you can make the most out of your watchlist:
By effectively using a watchlist, you can not only stay organised but also enhance your ability to make informed and timely trading decisions. This tool is essential for any trader who wants to keep a close eye on their potential investments and optimise their trading strategy over time.
Swing trading relies heavily on spotting the right moments to enter and exit trades, which is where technical analysis comes in. It gives you a toolkit for reading market trends and movements, helping you decide when to buy and sell. Let’s break down some of the key tools that can help you get the timing right:
Moving averages smooth out price data to create a single flowing line, making it easier to identify the direction of the trend. Swing traders often use:
Both types are used to determine support and resistance levels and can indicate a potential reversal in the market. For instance, a common strategy is to look for when a short-term moving average crosses above a long-term moving average as a signal to buy, and vice versa for a sell signal.
RSI is a momentum oscillator that measures the speed and change of price movements on a scale of 0 to 100. Typically:
Swing traders use RSI to gauge the strength of a stock’s recent price performance and to predict possible reversal points.
The Moving Average Convergence Divergence (MACD) helps you see where the trend might be heading by showing the relationship between two moving averages. It includes two lines: the MACD line and the signal line. A crossover of these two can be a powerful buy or sell signal. For instance, if the MACD line crosses above the signal line, it might be a good time to buy.
Chart patterns are essential for understanding market behaviour and predicting future movements. They can show whether a stock is likely to continue its current trend or reverse direction. Here’s how some of the common patterns work:
Triangles: These patterns signal what might come after a price consolidation. They come in three forms:
Channels: Channels help traders identify the potential upper and lower boundaries of price movements and are categorised as:
Understanding these patterns can provide valuable insights into potential future price movements.
For instance, a breakout from a symmetrical triangle could signal the continuation of the prior trend or a new trend beginning, depending on the direction of the breakout and accompanying volume.
Support and resistance levels are fundamental concepts in technical analysis:
Identifying these levels can help swing traders make better predictions about where prices are likely to change direction.
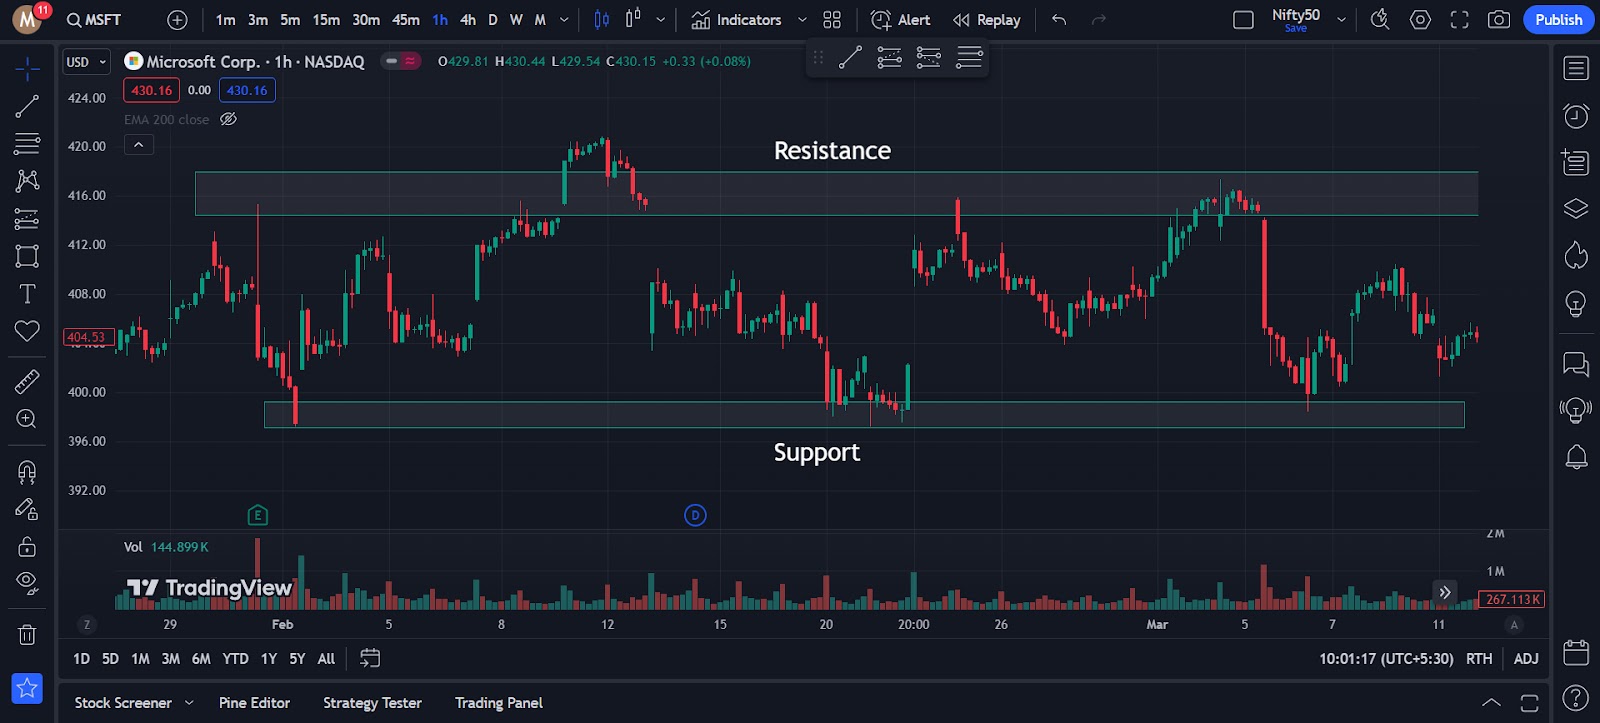
Looking at the chart for Microsoft Corp (MSFT), you can see how the stock price finds support at about $400 and hits resistance around $420. These levels are crucial for traders because they show where the stock price tends to stop falling or climbing.
When setting up your swing trading strategy, these price levels can be really useful. You could look for signs that the stock might rise from the $400 level, like an increase in trading volume or a positive signal from a momentum indicator like RSI. This could be a good time to think about buying. On the other hand, if the stock approaches the $420 mark and starts showing signs of slowing down, like less trading volume or a negative signal from RSI, it might be time to sell or short-sell.
Using support and resistance like this helps you make smarter decisions based on where the stock price has struggled or paused before. Just make sure to combine this with a look at the overall market and stick to your trading rules to improve your chances of success.
By getting good at using these technical analysis tools, swing traders can really sharpen their skills in spotting good trade opportunities. These tools are great not just for figuring out where the market might go, but also for setting clear markers for when to take profits or cut losses. This makes managing your trades simpler and helps keep your trading strategy on track.
Swing trading relies a lot on understanding the market’s mood and staying updated with key news. These factors have a strong impact on stock prices, and getting a handle on them can significantly boost your trading success.
Think of market sentiment as the overall mood or vibe of the stock market or a particular stock. It shows if investors are feeling good (bullish) or wary (bearish) about the future. Here’s how you can use this to your benefit:
News and big economic events can quickly change stock prices. Here’s why keeping an eye on the news is key:
Keeping a close eye on market sentiment and the latest news can really help you decide the best times to buy or sell. It’s all about grabbing the right opportunities and dodging potential pitfalls. This approach will make your swing trading smoother and could lead to better results.
Swing trading is all about catching short-term price movements in the stock market. To do this effectively, traders use a mix of strategies that help spot the best chances for making a profit. Let’s break down some of these strategies into simpler terms, including following trends, spotting reversals, and using Fibonacci levels to decide when to buy and sell.
This approach focuses on riding the momentum of existing trends, whether they’re going up or down.
This strategy is about spotting when a trend is about to change direction, letting you get in right at the start of a new trend.
Fibonacci retracement levels help identify where a stock price might pause or reverse after a significant move.
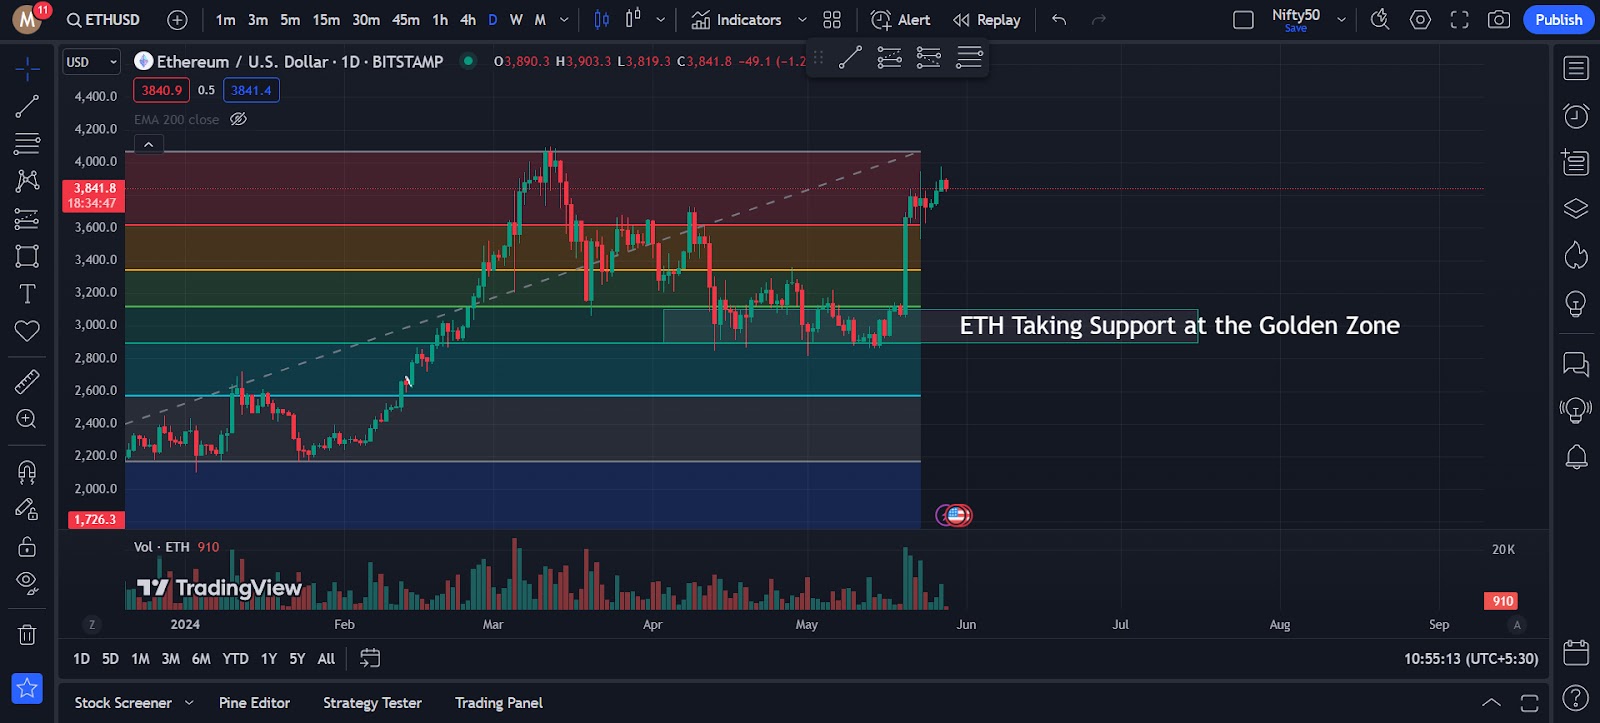
In the chart, you can see how Ethereum (ETH) has found support at the golden zone. This is a key area on the chart where traders often see a lot of buying activity, helping to prevent the price from falling further. For Ethereum, reaching this zone and not breaking below it suggests that there might be a strong interest in buying at these levels, which could indicate a potential upward move soon.
These strategies, when used together, can give you a well-rounded view of the market and
improve your chances of successful swing trading.They help clarify when to enter and exit trades, aiming to maximize profits and minimize risks. Remember, the key to swing trading is not just knowing what to do but also when to do it.
Good risk management is key to successful swing trading. It helps keep potential losses small and locks in profits before the market changes. Here’s how you can manage risk effectively:
Stop-loss and take-profit orders are tools that automatically close your trades at set price levels to protect your investments and secure your gains.
The risk-to-reward ratio helps you weigh the potential profit of a trade against the risk. This ratio is important to determine if a trade is worth taking.
Example of Risk-to-Reward Ratio: Imagine you’re looking at a stock priced at $100. You think it could go up to $120, but there’s a risk it could fall to $85. You set a stop-loss at $85 and a take-profit at $120. Your risk is $15 ($100 – $85), and your potential reward is $20 ($120 – $100). The risk-to-reward ratio here is 1.33 ($20/$15). Ideally, many traders aim for a ratio of 1:2, meaning they want to gain at least two dollars for every dollar they risk.
To integrate risk management into your trading, you need to apply these tools consistently and review them regularly. For example, if a stock becomes more volatile, you might need to adjust your stop-loss and take-profit levels.
Good risk management doesn’t just protect your money; it also keeps you mentally in the game by reducing stress and helping you make decisions based on logic, not emotion. This structured approach to balancing potential losses and gains is what sets experienced traders apart from beginners.
Choosing the right stocks is critical for swing trading success, yet traders often fall into
common traps. Being aware of these pitfalls can help you make better decisions and refine your trading strategy.
1. Chasing Performance
A frequent error is pursuing stocks that have already seen significant price increases, often driven by the fear of missing out (FOMO). This can result in buying at the peak, which carries a high risk of losses if the stock corrects or reverses.
Example: Suppose a stock jumps 30% in a short period due to a popular news item, without any real improvement in the company’s fundamentals. This stock may be due for a price correction. Instead of blindly following the uptrend, it’s smarter to assess if the rise is backed by solid reasons.
2. Ignoring Market Conditions
Stocks are influenced by the overall market environment. Ignoring this can lead to poor performance, even if the stock itself has strong fundamentals.
Example: In a generally bearish market, a fundamentally strong stock might still underperform if the entire market is trending downwards. It’s important to align your stock picks with broader market trends.
3. Overlooking Company Fundamentals
Focusing solely on technical analysis without considering the company’s fundamentals is risky. Fundamental analysis helps ensure the company is stable and not heading for financial trouble.
Example: You might find a stock with a great technical setup, but if the company is about to announce its quarterly earnings, any negative surprises could send the stock tumbling, affecting your investment.
4. Neglecting to Set a Proper Risk-Reward Ratio
It’s essential to evaluate the potential downside of a stock against the expected upside. A good risk-reward ratio ensures that potential gains justify the risks involved.
Example: Investing in a stock hoping for a 5% gain while risking a 10% loss is a strategy with a poor risk-reward ratio. Such imbalances can lead to significant losses over time.
5. Overcomplicating the Strategy
Using too many indicators or complicated strategies can lead to confusion and indecision, known as analysis paralysis.
Example: While multiple technical indicators can provide extensive data, they might also give conflicting signals. Simplifying your approach to use a few key indicators per trade can help you make clearer decisions.
6. Succumbing to Emotional Trading
Emotional trading can disrupt rational decision-making, leading to premature selling or holding onto losing stocks for too long.
Example: After a big loss, there’s a temptation to make back the lost money quickly, often prompting riskier trades. This can be avoided by sticking to a well-defined trading plan that includes predefined stop-loss and take-profit points.
By understanding and avoiding these common mistakes, you can improve your swing trading outcomes. Additionally, if you’re interested in learning more about common errors traders make, check out our blog post on the “10 Most Common Mistakes Traders Make.” It’s packed with insights that can help you avoid typical pitfalls and enhance your trading strategy.
In this blog, we’ve covered the essentials of finding the right stocks for swing trading. We’ve looked at how important it is to use tools like stock screeners, understand the significance of liquidity and volume, and interpret chart patterns. We’ve also emphasised the value of indicators like moving averages and the RSI to help identify the best entry and exit points.
Swing trading is a continuous learning process. Every session on the market offers new insights and opportunities to refine your approach. The more you engage with the market, practice your strategies, and adapt to new information, the better you’ll become at making informed trading decisions.
Remember, success in trading doesn’t happen overnight. It takes patience, persistence, and a lot of practice. So keep at it, stay committed to learning, and gradually, you’ll see your trading skills improve. Here’s to making wise trading choices and growing your proficiency in swing trading! Happy trading!
A good stock for swing trading typically has high liquidity, which allows for easier entry and exit without impacting the price too much. It should also exhibit consistent volatility that provides enough price movement to make a profit within a short to medium time frame. Furthermore, a stock that follows predictable patterns and responds well to technical analysis is ideal for swing trading.
It’s advisable to review your swing trading stock picks regularly, ideally weekly or bi-weekly, to ensure they still align with your trading strategy and market conditions. Regular review helps you adapt to any significant market movements or changes in stock performance.
Effective technical setups for swing trading often include trend-following indicators like moving averages and MACD, as well as momentum indicators such as the Relative Strength Index (RSI) and Stochastics. Chart patterns like head and shoulders, flags, and triangles are also useful for identifying potential entry and exit points.
To minimise risks in swing trading, establish strict risk management protocols, including
setting stop-loss orders to limit potential losses and take-profit orders to secure gains. Utilise a favourable risk-to-reward ratio, ideally no less than 1:2, ensuring potential rewards justify the risks. Diversifying your trades across different sectors or industries can also reduce risk.
The best tools for swing trading analysis include technical analysis software that offers real-time data, charting capabilities, and a range of indicators and drawing tools. Platforms like TradingView, MetaTrader, and ThinkorSwim provide comprehensive features that help traders analyse market trends and make informed decisions.
Picking a stock for swing trading involves several steps:

ETTFOS brings over 35 years of trading experience to deliver well-researched, educational content designed to enhance your understanding of the financial markets. Our blog covers key market insights and trading concepts to help you stay informed and sharpen your skills. Follow us for expert updates and in-depth articles.