In forex trading, support and resistance lines are essential tools that provide insight into price behaviour and market dynamics. Support represents the price level where a downtrend tends to pause due to a surge in buying interest, while resistance signifies the level where an uptrend typically pauses due to increased selling pressure. Understanding these concepts helps traders anticipate potential reversals and price movements.
In this blog, we will explore the most precise ways to draw support and resistance lines. We’ll discuss various methods and techniques to ensure you can accurately identify these critical levels.
By mastering these techniques, you can improve your trading decisions, manage risks more effectively, and enhance your overall trading strategy. Precision in drawing these lines is key to avoiding common mistakes and optimising your trading outcomes.
Support is a fundamental concept in forex trading, representing a price level where a downward trend tends to pause or reverse due to an influx of buying interest. When a currency pair’s price falls to this level, it often encounters increased demand, which helps to prevent further declines. Traders view this level as a ‘floor’ because it supports the price from falling further.
For instance, if the EUR/USD pair has repeatedly bounced back from a price level of 1.1000, this level is considered support. Traders might anticipate that the price will hold above this level and use it to set buy orders or stop-loss levels.
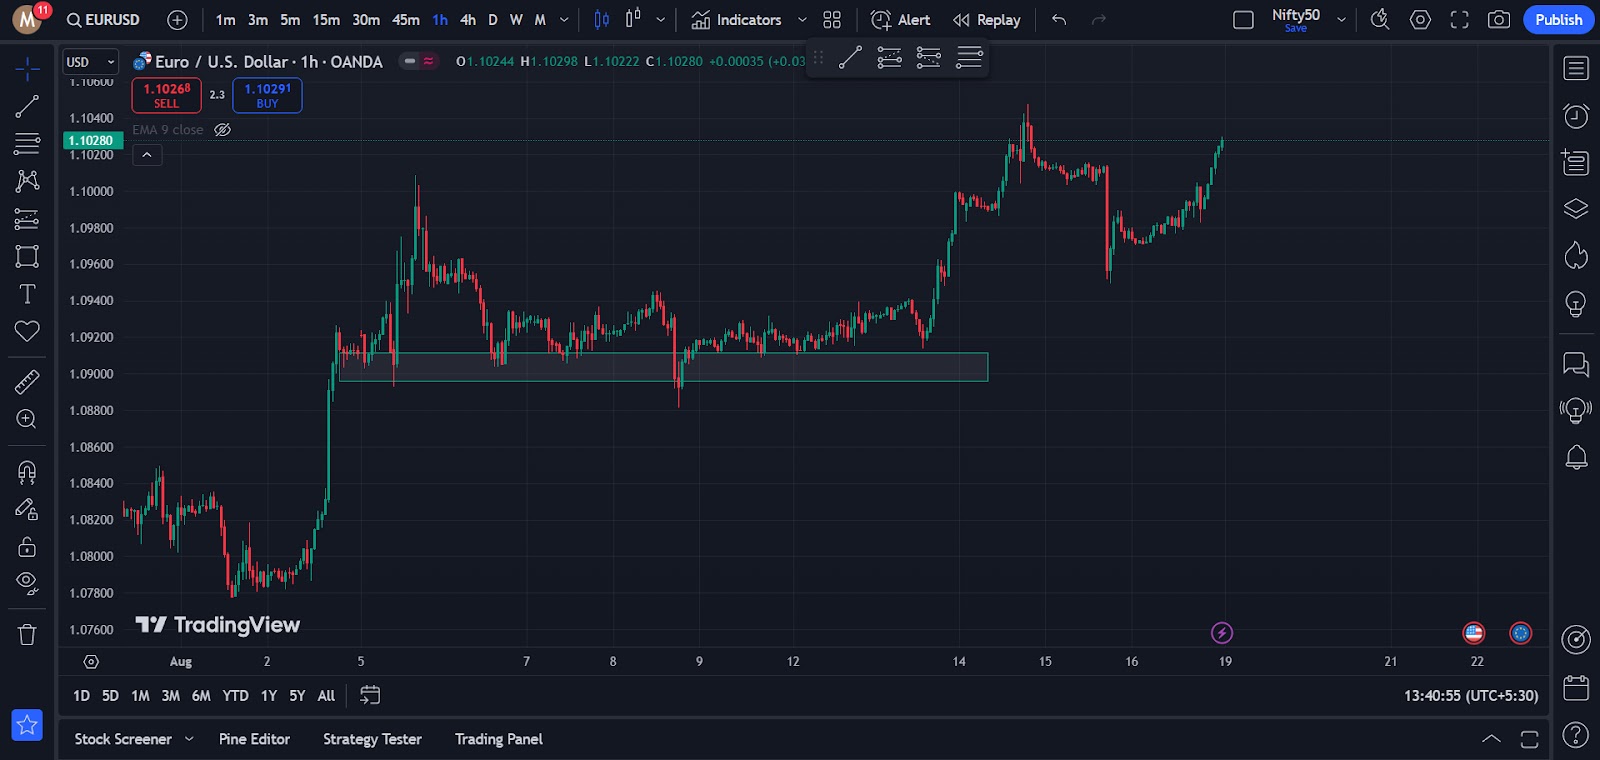
As you can see, around the 1.09110 price level, the pair is continuously pushing upwards after taking support at this zone. This area acts as a strong support zone for the pair, indicating that buyers are stepping in to prevent further declines and pushing the price back up.
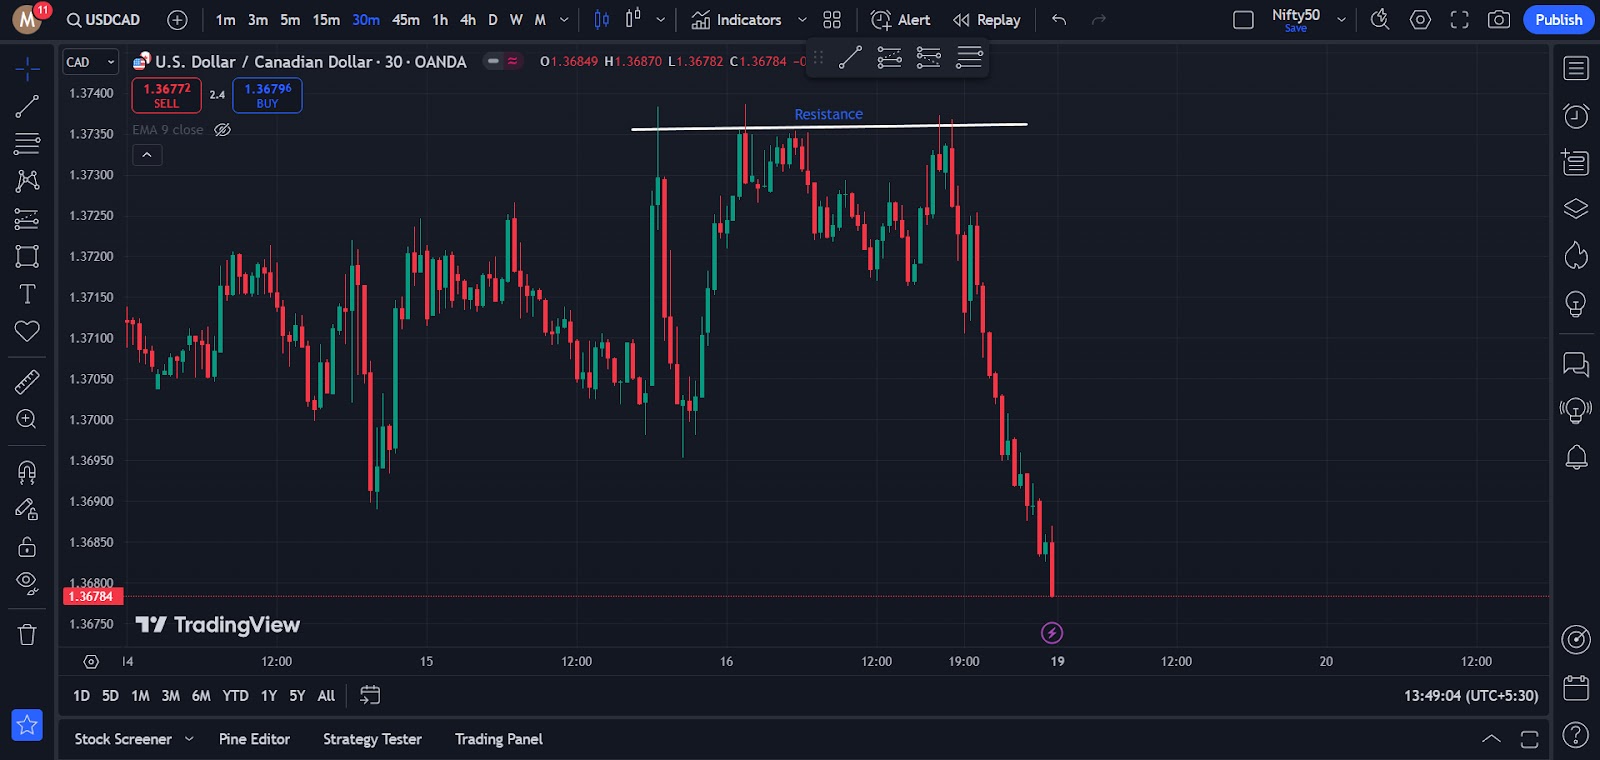
Resistance is the opposite of support and represents a price level where an upward trend tends to pause or reverse due to an increase in selling interest. At this level, the supply of the currency outweighs demand, causing the price to struggle to rise further. Traders perceive this level as a ‘ceiling’ that caps the price’s ascent.
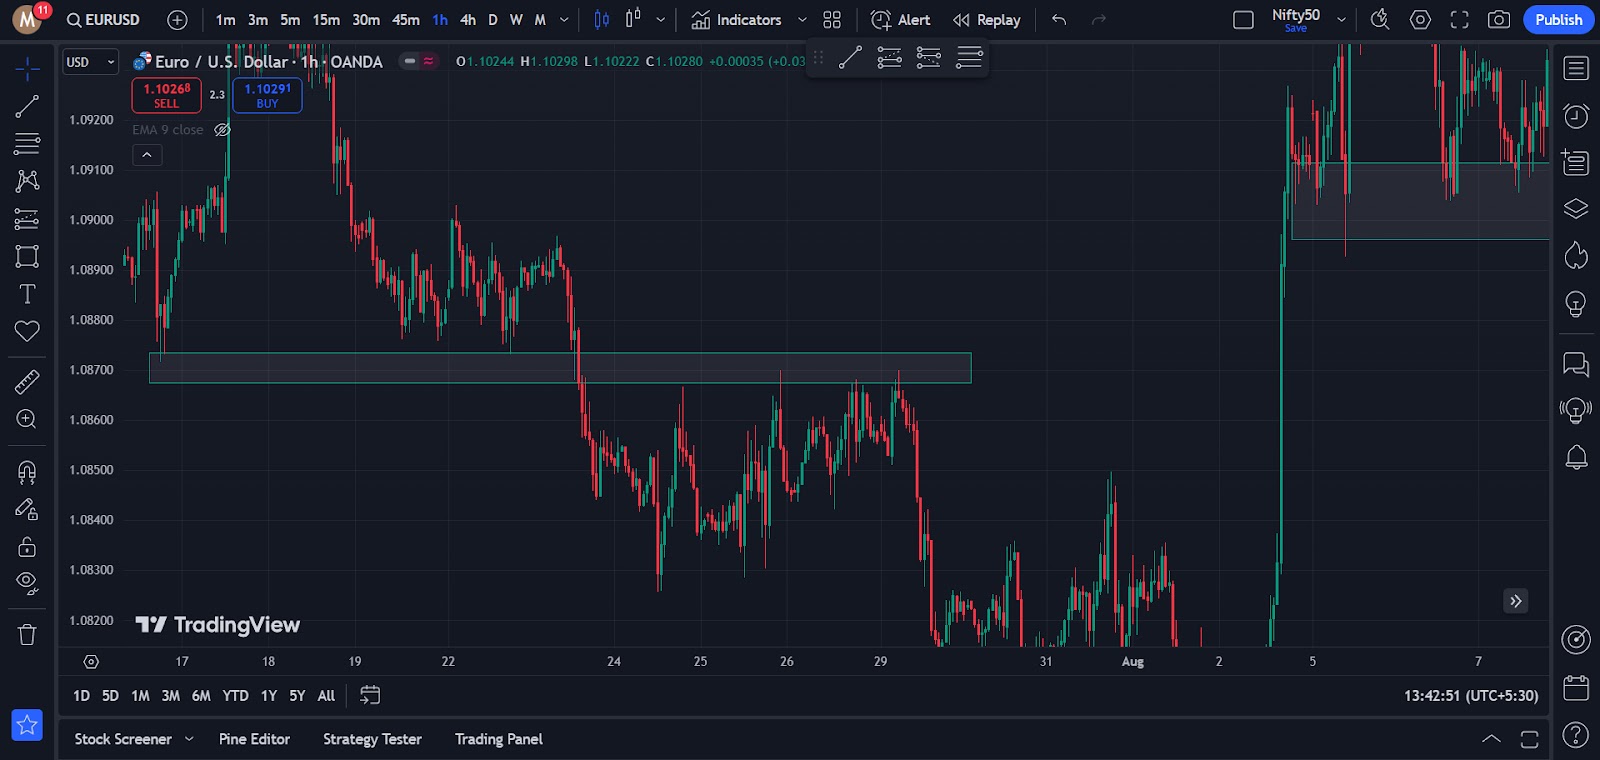
As you can see, around the 1.08700 price level, the pair is taking resistance. Previously, this was a support zone, but now it has turned into a resistance zone, with sellers stepping in to cap the price from rising further.
Support and resistance play a pivotal role in forex trading as they help traders identify potential reversal points and gauge the strength of trends. Understanding these levels allows traders to make more informed decisions about entry and exit points.
Now, let’s explore some of the most common methods to draw support and resistance lines.
Horizontal lines are one of the most straightforward methods for identifying support and resistance levels. This technique involves drawing lines at price levels where the currency pair has previously reversed direction or stalled. These levels are typically marked by multiple touches or bounces of the price, indicating significant buying or selling interest.
Trend lines are used to identify dynamic support and resistance levels that adjust with the price movement. These lines are drawn by connecting consecutive highs (for resistance) or consecutive lows (for support) on a price chart. Trend lines help traders recognize the direction of the trend and potential areas where the price might reverse or consolidate.
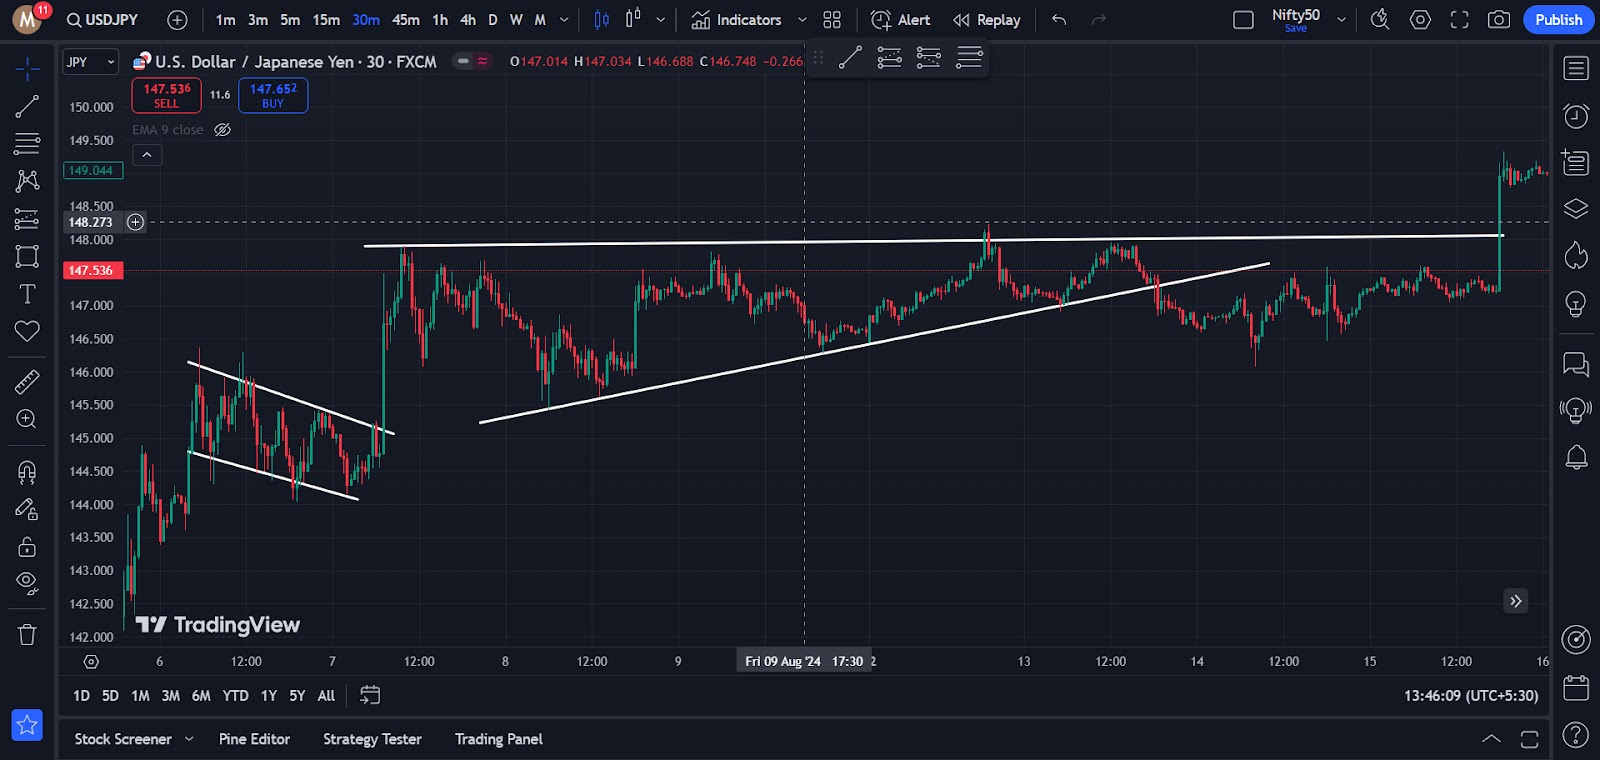
For example, in an uptrend, a trend line can be drawn by connecting the lows of each price dip. This line acts as a support level that rises with the trend. In a downtrend, connecting the highs of each price peak forms a resistance trend line. Trend lines are valuable for understanding the slope of the trend and can help identify potential breakout or breakdown points.
As you can see in the USD/JPY pair, once the price breaks the trend line, it often leads to a significant increase in volume and a stronger trend in the direction of the breakout
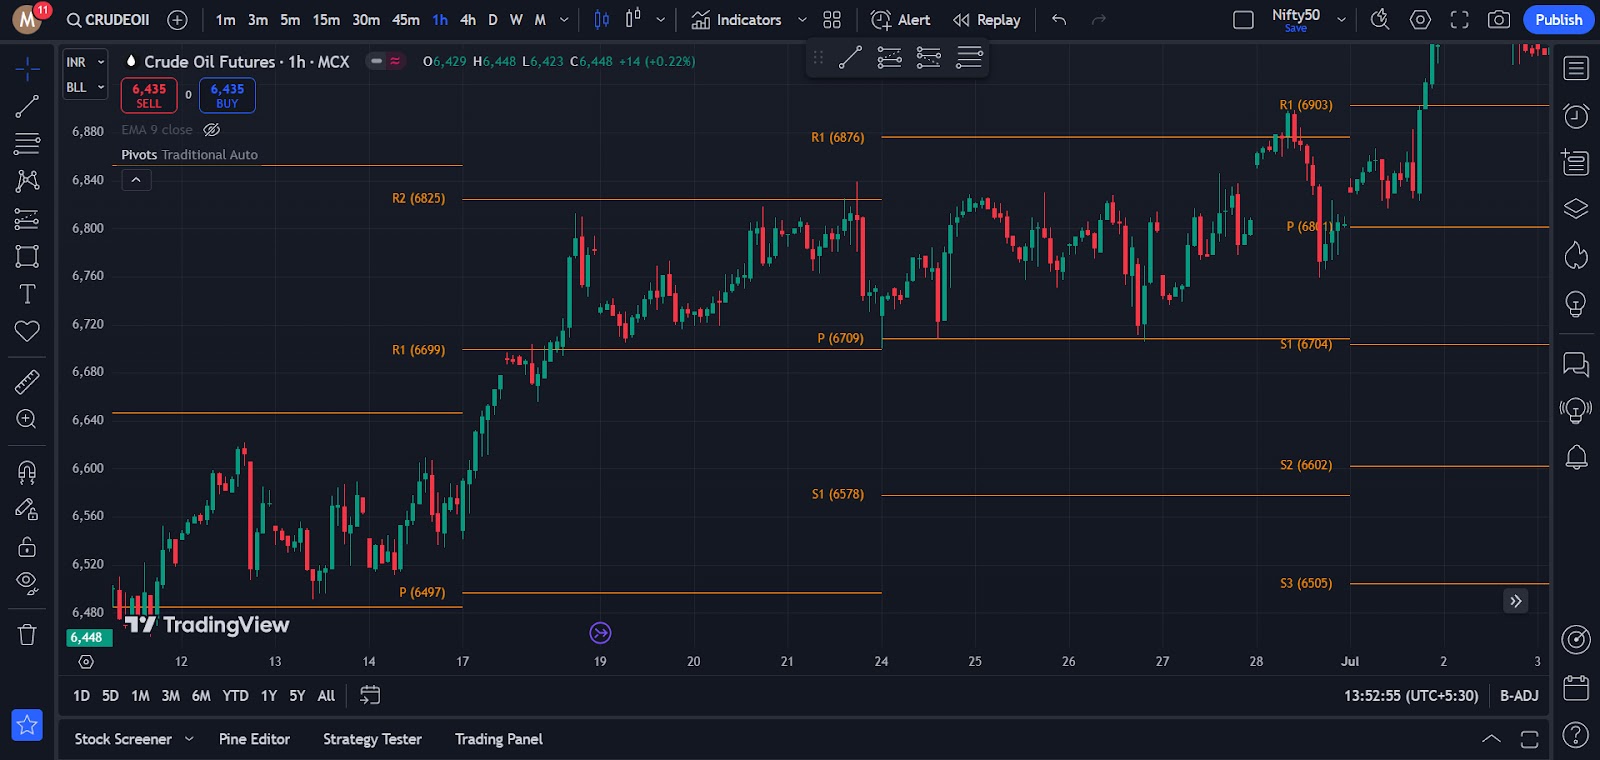
Pivot points are calculated using the previous day’s high, low, and closing prices. These points help traders forecast potential support and resistance levels for the current trading day.
Pivot points are particularly useful in identifying potential market turning points and setting trading ranges for the day. They provide a systematic way of estimating where the price might encounter support or resistance based on previous price action.
Fibonacci retracement levels are based on the Fibonacci sequence and are used to identify potential support and resistance levels during a price retracement. Key Fibonacci levels include 23.6%, 38.2%, 50%, 61.8%, and 76.4% of the previous price move. These levels are drawn by taking a significant price move and applying the Fibonacci ratios to the vertical distance of that move.
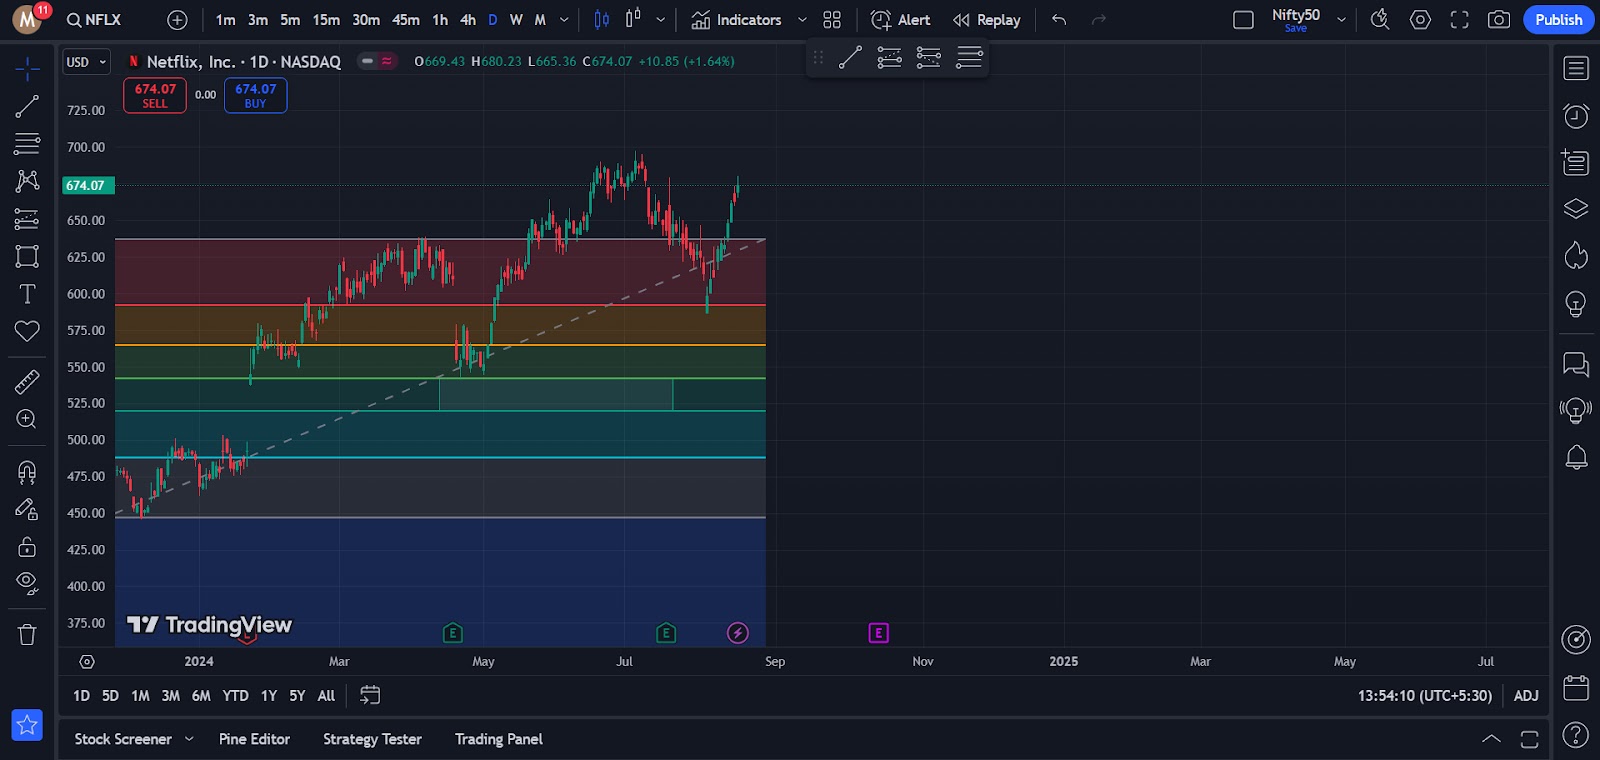
In the case of Netflix stock, the price took support in the golden zone around the 0.5 Fibonacci level, which was between the price range of $525 to $550. After touching this key support level, the stock began to trend upward, eventually increasing by 30%. This demonstrates how Fibonacci retracement levels can provide reliable support zones during a retracement before the price resumes its upward momentum.
Each of these methods—horizontal lines, trend lines, pivot points, and Fibonacci retracement—offers a unique approach to drawing support and resistance lines. Combining these methods can provide a more comprehensive view of potential price levels and improve the accuracy of trading decisions.
By understanding and utilizing these techniques, you can enhance their ability to identify critical price levels and make more informed trading choices.
Next, let’s look at some effective tips to enhance the accuracy of your support and resistance lines.
Consistency is key when it comes to accurately drawing support and resistance lines. Ensure that you apply the same methods and criteria across different charts and timeframes. This uniformity helps in avoiding conflicting signals and ensures that your analysis remains reliable over time. Whether you are using horizontal lines, trend lines, or Fibonacci retracement, sticking to a consistent approach will help you identify the most significant levels and make more informed trading decisions.
Market conditions are constantly changing, so it’s important to regularly update your support and resistance lines. As new price data becomes available, adjust your lines to reflect the most recent highs, lows, and pivot points. This practice ensures that your analysis remains relevant and that you are basing your trading decisions on the most current information. Regular updates help in adapting to market shifts and maintaining an accurate perspective on potential price movements.
While it’s important to use multiple methods to identify support and resistance levels, avoid overcomplicating your charts with too many lines or indicators. Having too many elements on your chart can lead to confusion and make it harder to identify key levels. Focus on the most relevant and significant support and resistance levels, and use them to guide your trading strategy. Simplifying your analysis can lead to clearer insights and more effective decision-making.
In this blog, we explored the essential concepts of support and resistance in forex trading. We learned how these levels act as key indicators of potential price reversals and trend confirmations. The blog covered various methods to accurately draw these lines, including horizontal lines, trend lines, pivot points, and Fibonacci retracement. We also discussed tips for enhancing the accuracy of your analysis, such as maintaining consistency, regularly updating your charts, and avoiding overcomplication. By understanding and applying these techniques, you can improve your trading strategy and make more informed decisions in the forex market.
Support and resistance lines are key levels on a price chart where the price tends to pause, reverse, or consolidate. Support acts as a ‘floor’ that stops the price from falling further, while resistance acts as a ‘ceiling’ that prevents the price from rising higher.
To draw support and resistance lines, identify price levels where the currency pair has previously reversed or stalled. You can draw horizontal lines at these key price levels or use trend lines to connect consecutive highs or lows for dynamic support and resistance.
Support and resistance levels are important because they help traders identify potential reversal points, confirm the strength of trends, and set entry, exit, stop-loss, and take-profit levels, all of which help in managing risk and improving trading accuracy.
Fibonacci retracement levels help identify potential support and resistance during a price retracement by applying specific Fibonacci ratios (23.6%, 38.2%, 50%, 61.8%, and 76.4%) to the previous price move. These levels indicate where the price might pause or reverse before continuing the trend.
Horizontal lines mark static price levels where the price has previously reversed or consolidated, while trend lines are dynamic and follow the price’s movement, connecting consecutive highs (resistance) or lows (support) to show the overall trend direction.

ETTFOS brings over 35 years of trading experience to deliver well-researched, educational content designed to enhance your understanding of the financial markets. Our blog covers key market insights and trading concepts to help you stay informed and sharpen your skills. Follow us for expert updates and in-depth articles.